

By Gil Morales, CEO, Gil Morales & Company, LLC
In my recently published book, “Short-Selling with the O’Neil Disciples: Turn to the Dark Side of Trading,” (John Wiley & Sons, April 2015), I discuss the short-sale set-up chart pattern known as the “Punchbowl of Death,” or “POD” as I like to refer to it in acronym form. Like the more classical and orthodox “Head & Shoulders” formation, the POD is simply another template, albeit a somewhat unorthodox one, that I use to identify potential short-sale targets in-the-making. What distinguishes the POD from other short-sale patterns is that it generally occurs in what we would consider a very “hot” stock that has a huge prior upside move, then breaks down sharply for 18-20 weeks or more, bottoms out, and then stages an equally sharp upside move of about the same duration. This move generally takes it right back up to the prior highs, at which point the stock becomes vulnerable to a sell-off.
The essential rationale for why a POD works is the simple idea that a “hot” stock which has a big upside move and then tanks severely will eventually attract bottom-fishers who see the huge decline as a “second chance” to buy the stock. As these bottom-fishers step in, a new speculative feeding frenzy ensues, and the stock moves relatively rapidly back up to the hold highs, forming a very large “cup” or, more accurately and colorfully, “punchbowl” formation. But the problem with this punchbowl formation is that the rally up the right side occurs too quickly to be sustainable on a longer-term basis, and eventually becomes to a new wave of selling when things become quite obvious at the right side peak of the pattern, turning it into a “Punchbowl of Death.”
Mobileye (MBLY) in 2015 provides a very clear example of how a POD works in Chart 1, below. We can see that after the stock comes public in early August 2014 it has a very sharp run up where it more than doubles from its IPO offering price of $25 a share. This sharp run-up tops out in early October 2014 and is then followed by a steep, sharp, 21-week decline of -46.2% off the peak. MBLY’s peak at that time coincides with a four-week correction in the NASDAQ Composite Index, and once that general market correction is over MBLY’s downtrend finally bottoms several weeks later in February of 2015. An equally steep and sharp rally back up to and just beyond the prior highs of September 2014 then follows. After attempting to break out to new highs from the right side of what is now a clear POD formation in August 2015, the stock blows apart and plummets to the downside. Once the stock fails on the August breakout attempt, a short-sale signal is issued and short-sellers quickly realize a substantial profit.
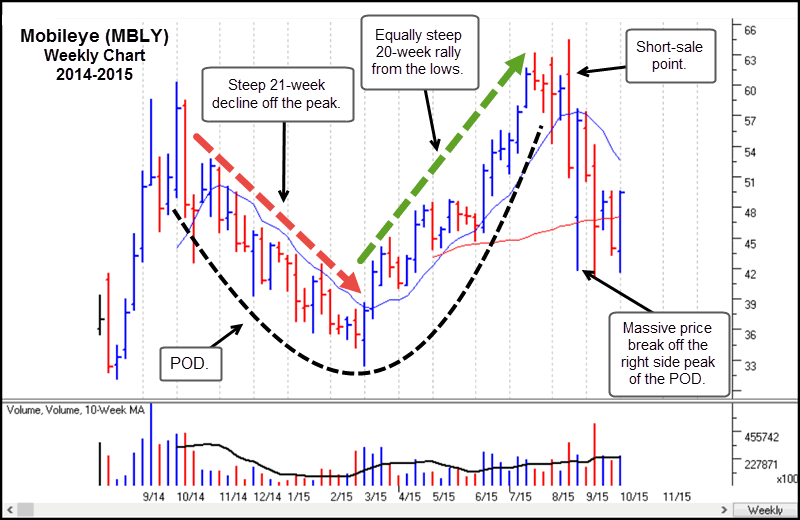
Chart 1 – Mobileye weekly chart, 2015. Chart courtesy of HGS Investor Software, LLC, ©2015, used by permission.
The alert reader may notice that a POD formation actually offers two profit opportunities within the pattern on both the long and the short side. In my studies of POD formations I have often theorized that if one could identify buy signals within the pattern after the low of the POD is put in, one could actually play the sharp run up the right side of the POD. The primary problem to be solved in this case is obviously where one finds these buy signals, or rather “clues” given that they are sometimes a bit more subtle than your standard-issue “base breakout.” I should also emphasize that on the way up you are operating solely on the basis of these clues to confirm your theory that the stock may be forming a POD and hence have the potential to rally back to the old highs. This is what I refer to as the “POD Long Theory.” Let’s see how this works.
In Chart 2, below, I show a daily chart of MBLY in 2015 that focuses on the right side of the POD you see in Chart 1. At the very low in March 2015 I am starting to pick up some deep oversold signals on my charts, and sure enough, the stock gaps up off the lows on big volume at Point 1. The stock continues higher from there and has a huge-volume supporting day at Point 2. Eventually it corrects and builds a short sideways consolidation before gapping up at Point 3 on very heavy volume, a move that qualifies as a “buyable gap-up” which is described in detail in our first book, “Trade Like an O’Neil Disciple” (John Wiley & Sons, 2015). Notice how the day before the stock gapped-up it traded down into its green 20-day exponential moving average on extremely light volume, indicating that selling was drying up prior to the move.
As the stock comes up off the lows of the POD, it is important to remember, however, that there is plenty of “overhead supply” from the left side of the chart, in other words investors who erroneously bought on the way down on the left side of the POD and soon found themselves underwater. As the stock comes back up the right side, it will logically encounter selling from those wrong-way buyers who now see an opportunity to get out even. Vive le difference!
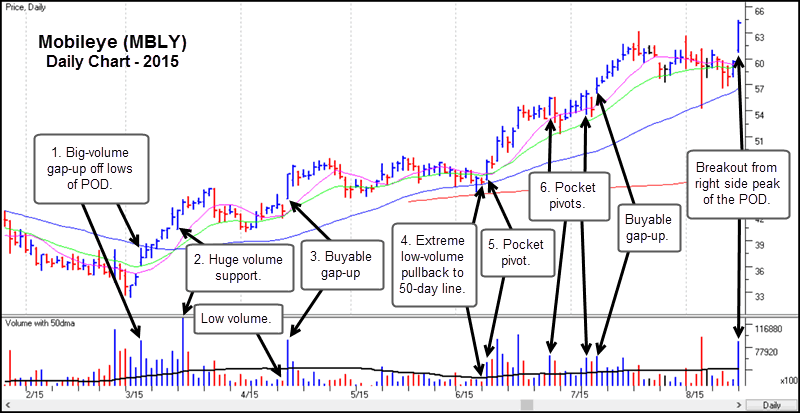
Chart 2 – Mobileye daily chart, 2015. Chart courtesy of HGS Investor Software, LLC, ©2015, used by permission.
All of the constructive action occurring on strong upside volume that extends from Points 1 to 3 now gives you some idea that the stock may have some impetus behind it to establish a firm low and ensuing uptrend. At this point you could then extrapolate the formation of a possible POD that would include a rally back up towards the October 2014 highs. We now see that at Point 5, after having some time to work off some of the overhead inherent in the left side of the pattern, MBLY is able to push off the 50-day moving average on strong volume that qualifies as a pocket pivot buy point. The day before at Point 4, a major clue was found in the extreme volume dry-up on the pullback into the 5-day moving average. This was a critical piece of the puzzle to pick up and put into place, and on that day I blogged to my Gilmo Report members that the stock was in a “voodoo” buy position. The term “voodoo” comes from the acronym (VDU), which in turns stands for “volume dry-up.” The move from Point 4 produced a roughly 40% gain over the next month or so before the stock peaked and began to build a short consolidation at the right side peak of the POD.
In Chart 3, below, I focus on the right side peak of MBLY’s POD formation in Chart 3, below. Notice that in mid-August 2015 MBLY attempts to break out on very strong volume. At this point, however, MBLY’s rally is now quite obvious, particularly to those who employ overly simplistic “Technical Analysis 101” base breakout methods. At that time, I blogged to Gilmo Report members that this breakout should be watched for any signs of failure as it could bring about the final formation of a completed POD topping pattern for MBLY. And that is precisely what occurred. The breakout failed, and once the stock began to fall back into the prior base formed between mid-July and mid-August, it was a clear short-sale at that point. Over the next few days, it produce a phenomenal downside short-sale gain in the neighborhood of 30% or more, depending on where a short-sale trade was entered.
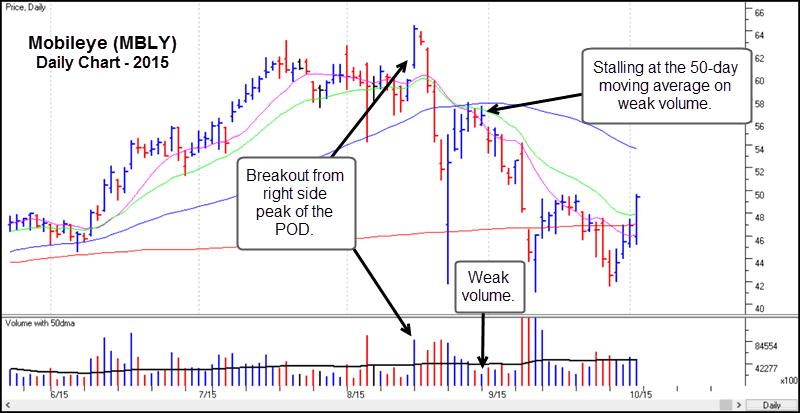
Chart 3 – Mobileye (MBLY) daily chart, 2015. Chart courtesy of HGS Investor Software, LLC, ©2015, used by permission.
Thus we see how it is possible to “drink from both sides of the punchbowl,” by using what using what we already understand about how PODs evolve and form to go long and then short the stock within the same overall POD formation. In my view, this sort of creative and anticipatory thinking that is rooted in clear “knowns” regarding how certain patterns evolve under certain market conditions is the only way to gain an edge in the current market environment. Think about this: in an age where many believe machines are doing most of the trading, what advantage do humans have over machines? Well, two things, I would say. The first is, we have a “soul,” while machines likely do not. The second, and more important advantage that humans have over machines is that possess the ability to utilize our creativity. Therefore it is within the realm of creativity, rooted in solid analysis and understanding, where we gain the crucial edge in these tough market times.
Gil Morales is a proprietary trader and the CEO of Gil Morales & Company, LLC, a registered investment advisory firm, as well as the author of the Gilmo Report (www.gilmoreport.com). He is also a principal and managing director of MoKa Investors LLC and Virtue of Selfish Investing, LLC, as well as a co-author and co-founder with his colleague, Dr. Chris Kacher, of www.selfishinvesting.com. He and Dr. Kacher are the co-authors of the best-selling books, “Trade like an O’Neil Disciple: How We Made 18,000% in the Stock Market” (John Wiley & Sons, August, 2010), “In the Trading Cockpit with the O’Neil Disciples,” (John Wiley and Sons, December 2012), and their newest book, “Short-Selling with the O’Neil Disciples: Turn to the Dark Side of Trading” (John Wiley & Sons, April 2015). He is a former internal portfolio manager for William O’Neil + Co., Inc., where he also served as Chief Market Strategist, Vice-President and Manager of the firm’s Institutional Services group from 1997-2005, and co-authored with William J. O’Neil a book on short-selling, “How to Make Money Selling Stocks Short” (John Wiley & Sons, 2004).

