

Here are 9 facts about the weekly chart of the Dow Jones Industrial Average.
- The highest it’s ever been, thus far, is 18,351.36
- On 8/4/15 it made a low of 15,370.33, which represents a 2,981.03 drop or a 16.24% drop in price.
- That drop took 13 weeks.
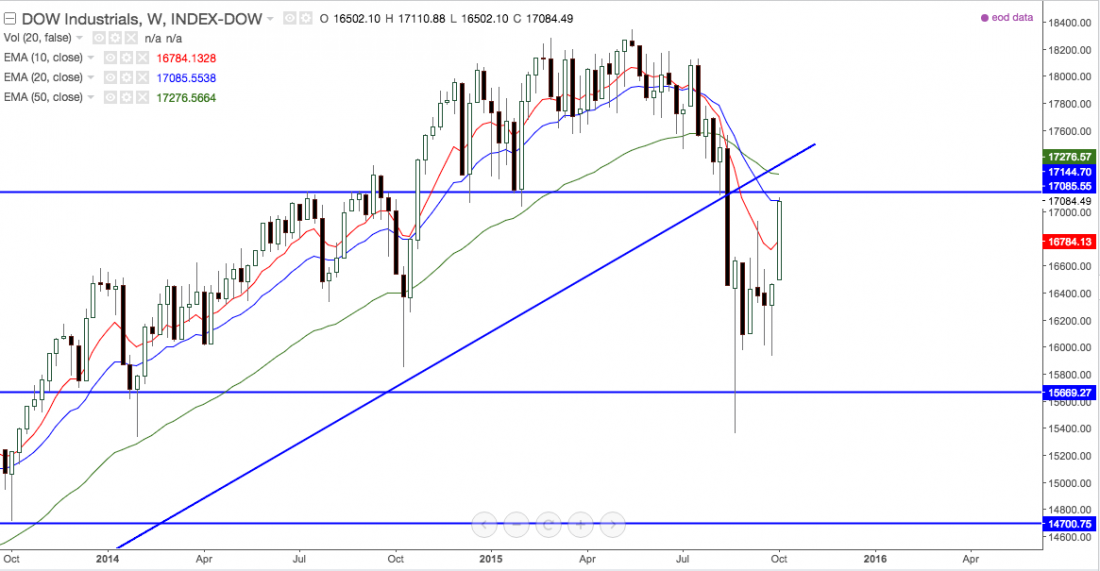
- The 10 and 20 exponential moving averages have crossed the 50 exponential moving average
- The last time this happened was between the months of August and October of 2011.
- The 100 simple moving average on a weekly chart is at 17,063.74
- The 20 exponential moving average on a weekly chart is at 17,085.55
- The Dow Jones closed at 17,084.49 on Friday.
- The Relative Strength Index (based off a setting of 9 on the close) is at 51.6050, which really represents neutrality.
Now for some quick opinions: If The Dow truly is making a head and shoulders pattern on a weekly chart, the price action right now is retesting the neckline of that head and shoulders, along with some strong moving averages. I personally think we will see a repeat of 2011 where the market forms a double bottom and then toward the early part of December we continue higher to make new highs in the future. The 16% retracement was a healthy one that would allow the sustainability for the markets to continue higher. There are a lot of similarities between the candles, chart patterns and averages from October 2011 and October 2015.
However, I am prepared if the markets do not continue higher. For me to be confirmed bearish in this market, the Dow Jones Industrial Average needs to not break higher than 17,300 and close below 15,500. I will be very cautious trading the initial bearish moves and only taking the retests of breakouts, not the breakouts themselves.
This is a great time to start creating some trading plans and following through on them! Enjoy the upcoming earnings season, traders!

