

You’ve probably heard a lot about the gold-to-silver ratio, but you might not have taken the time to stop and think about its implications. Further, you’ve probably bypassed it as a tool for determining optimal times to speculate in precious metals. We’d like to take this opportunity to point out some of the key takeaways from the strategy of using the gold-to-silver ratio to determine higher probability circumstances in the metals futures and options markets.
What is the gold-to-silver ratio?
First, let’s start by defining the ratio. Clearly, its title speaks for itself but to simplify the definition, the gold-to-silver ratio is simply the amount of silver it takes to purchase once ounce of gold. For instance, if the gold-to-silver ratio is 50-to-1, it would take 50 ounces of silver to buy 1 ounce of gold.
The gold-to-silver ratio has been tracked for roughly a century; during that time we’ve seen it fall into the 20-to-1 area, and increase toward the 100 to 1 area, but it is probably most comfortable between 50-to-1 and 60-to-1.
The “lazy”, yet most efficient, way to follow the gold-to-silver ratio is to visit one of the dozens of websites that track it such as Kitco (http://www.kitco.com/Gold_Silver_Ratio_Charts/gold-silver-ratio-charts.html). However, it can easily be calculated. Simply take the price of gold and divide it by the price of silver. For instance:
$1150 (gold price) / $16.00 (silver price) = 71.875 (or about 71 to 1)
To reiterate, assuming the price of gold and silver noted above it would take 71.875 ounces of silver to purchase a single ounce of gold.
How to use the gold-to-silver ratio
The gold-to-silver ratio is not the be-all and end-all solution for successful precious metals trading, but it can certainly be a highly valuable tool for those willing to corroborate their technical, fundamental, and seasonal analysis with another source. In addition, it might help you to determine which trading vehicle to use (gold or silver).
The general usefulness of the ratio to traders is to determine which metal is expensive, or cheap, relative to the other. A low ratio suggests that gold is cheap relative to silver, but a high ratio depicts an environment in which gold is expensive relative to silver. In theory, those looking for directional trades in the precious metals market should look to the gold-to-silver ratio for guidance on which metal to speculate in. However, in my opinion this is only a valid strategy during times in which the ratio is trading at an extreme level. Specifically below 40 or above 75. If the ratio is between these levels, any relative over, or under, pricing could continue.
In addition to alerting us to which metal might be trading at a better value, the gold-to-silver ratio sometimes identifies major highs and lows in the metals markets. For example, the precious metals markets are more prone to finding a major high or low during an environment in which the gold-to-ratio is at an extreme level. It isn’t as simple as assuming a high ratio would equate to a bottom in precious metals, or a low ratio is a precursor to a significant high in metals. Instead, we’ve seen historical tops and bottoms with the ratio is at both extremes. For example, the now infamous metals rally in that started in the late 1960s to early 1970s began with a gold-to-silver ratio near 20. On the contrary, the 1980 peak in gold and silver also occurred while the ratio hovered near 20. To clarify, an extreme in the ratio can be considered a signal that prices in the precious metals markets might also be at an extreme; thus, the optimal trades in that environment might be counter-trend.
The current landscape
The ratio is currently hovering in the mid-to-low 70s-to-1, meaning it requires about 72 ounces of silver to purchase an ounce of gold. Such an inflated ratio suggests that any trend change in precious metals would likely result in silver outpacing gold. In fact, we haven’t seen the ratio at levels this lofty since 2008, just before the financial collapse. Following the peak of the ratio in 2008 silver made a miraculous run to $50 per ounce! We are not of the opinion that we’ll see $50 per ounce in silver again anytime soon, or maybe even our lifetime, but the low $20s is absolutely doable within the next year, or maybe even months if fundamental changes develop quickly.
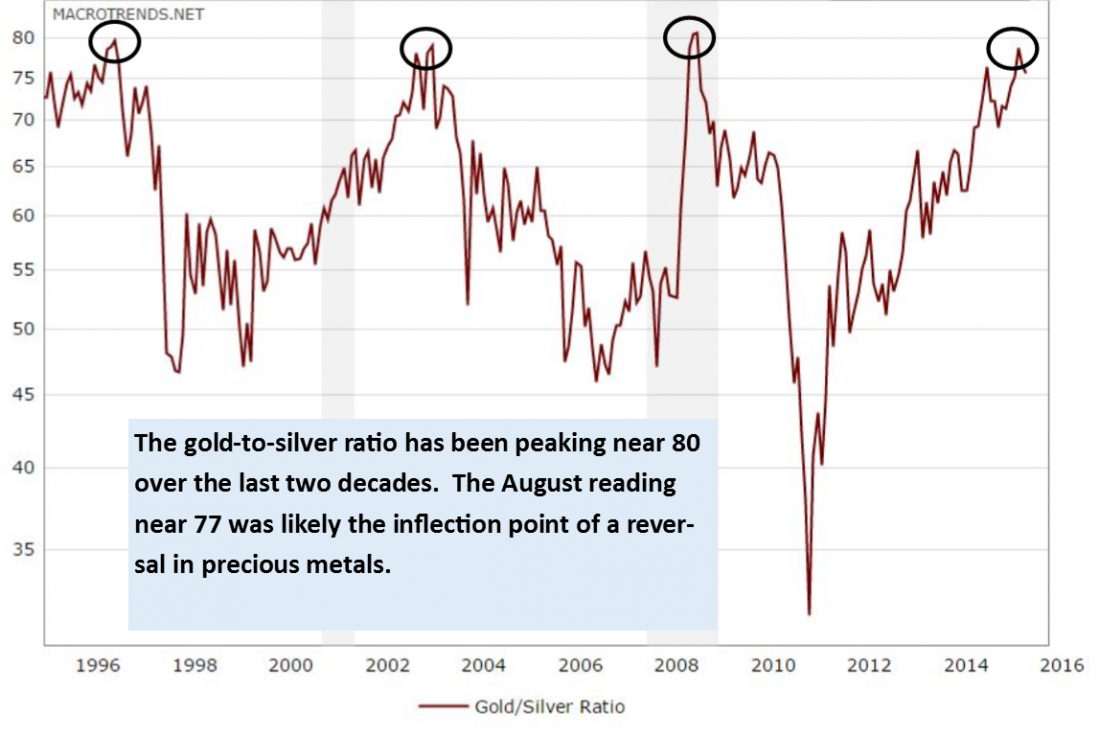
If you prefer speculating in gold, over silver, I can’t blame you. There is more liquidity in gold futures, particularly in the options, the margins are more reasonable, and price movement is more fluid. Despite our expectation of silver outpacing gold in the foreseeable future to revert the ratio back to a more normal level, the elevated ratio suggests that the precious metals market, as a whole, likely found an inflection point in the summer of 2015 (at the time, gold was hovering near $1,080 and the gold-to-silver ratio was at a haughty 77ish).
*There is substantial risk of loss in trading futures and options. There is unlimited risk in option selling!
Carley Garner is the Senior Strategist for DeCarley Trading, a division of Zaner, where she also works as a broker. She authors widely distributed e-newsletters; for your free subscription visit www.DeCarleyTrading.com. Her books, “A Trader’s First Book on Commodities,” “Currency Trading in the FOREX and Futures Markets,” and “Commodity Options,” were published by FT Press.

