

A sign on the door of Opportunity reads Push.
Anonymous
The financial sector has pulled back nicely during the market sell off in August, setting up a nice opportunity for the contrarian player. The masses are fixating on whether or not the Fed will raise interest rates by a minuscule 0.25%. While they fixate on this issue opportunity could be at hand; now might be the time to put some money into banks. One simple way to achieve this would be via KBW Nasdaq Bank Index (BKN).
A number of analysts are comparing the fact that Citibank and Deutsche bank are still trading well below their pre 2008 highs, as a sign that the markets are going to crash and burn. They are trading below their 2008 highs: that part is true. The same argument could have made for the NASDAQ, but it did eventually test its old highs even though it took a long time to do so. If you look at a long term chart from 1999 to present, the trend was generally up after the correction ended in 2003. Now you could have moaned and groaned as the NASDAQ trended higher, stating that this was not a valid rally as the index was trading well off its highs. Misery and loss of profit would have been your only rewards. Many stocks such as PCLN, AMZN, etc, raced to all-time new highs even when the NASDAQ was slowly meandering upwards to eventually challenge its all-time highs of 2000. The point we are trying to make is that naysayers will always find something to scream about. It does not mean that prudence is not warranted from time to time. It just means that you should never become one with fear.
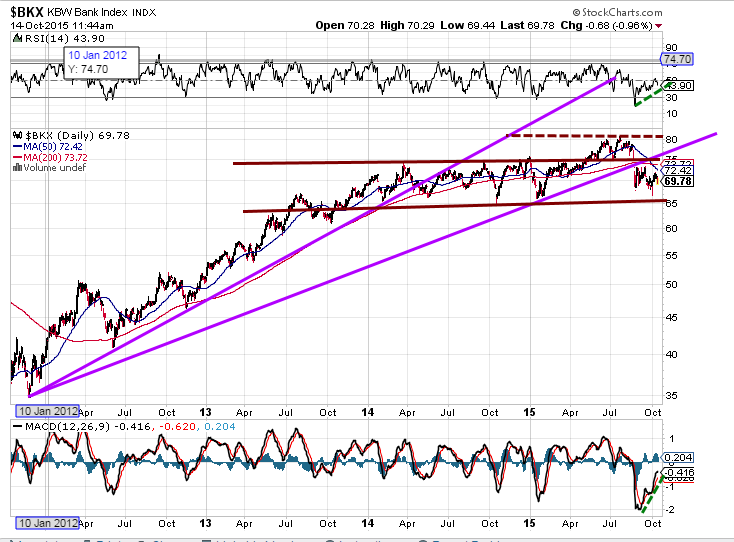
A look at the banking index shows that it is consolidating, and as long as it does not trade below 65.00 on a monthly basis, the outlook will remain bullish. There is overhead resistance at 74.50, and it will take a weekly close above this level to suggest a move to the 80 ranges is underway. If it is going to trade any higher, a monthly close above 81 will be required. If it achieves this, it will be on its way to put in a series of new highs.
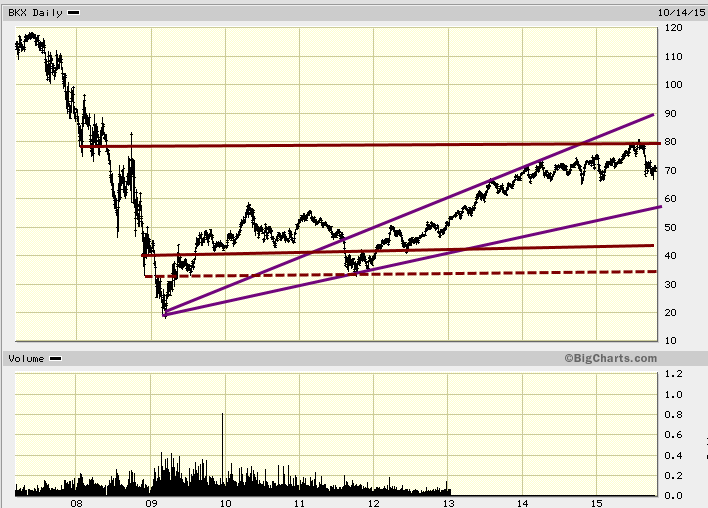
This 10 year chart illustrates how much the banking index has recovered from the mortgage crisis. Many might look at the chart and state, “well, it’s still trading significantly below its all-time highs”, so the outlook must be downright negative. These individuals conveniently forget to take into consideration just how long it took for the index or market to reach that point in the first place. If you look at things from this perspective, then every correction would have to be viewed through a negative lens. For a brief period of time the pattern would not look great. For example, you could make the same argument by looking at a market over a very short term time frame, such as 60 minutes, or even a one minute chart, etc. On a 60 minute chart, a market that looks bullish on one year chart could look like it was crashing because on 60 minute chart, the pattern is completely different. You have mini corrections and rallies occurring all the time, and even more so if you move to a one minute chart; you would see crashes and strong rallies taking place on a much faster scale. Thus, at any given point, the market could appear to be rallying or crashing. The time scale could distort your view, one person could walk away with the feeling that the market was in bullish phase, while the other would feel certain that the markets were in a bearish phase. The time scale in this instance could push one towards forming the wrong conclusion. Instead of looking at how far a market has to rally to catch up to its old highs, why not look at how far it has already traded. The importance should always be on the now; the now is all you control, the second before is gone and unchangeable, the second to come is beyond your reach.
So what’s next?
Unless the index closes below 45 on a monthly basis, there is nothing to worry about. The index is topping because it has run into strong zones of resistance established in 2008 (former support now turned to resistance); these levels held for so long, one should expect a market to pull back on a test of these levels. Ideally, the index would pull back to the 60 ranges, knocking out the weak players in the process and paving the way for the next leg up. A monthly close over 83 should set the path for a test of 105-107 ranges. The following stocks are the strongest in the regional banking sector, so you could consider opening positions in them; PNC, BKU, BK and NTRS

