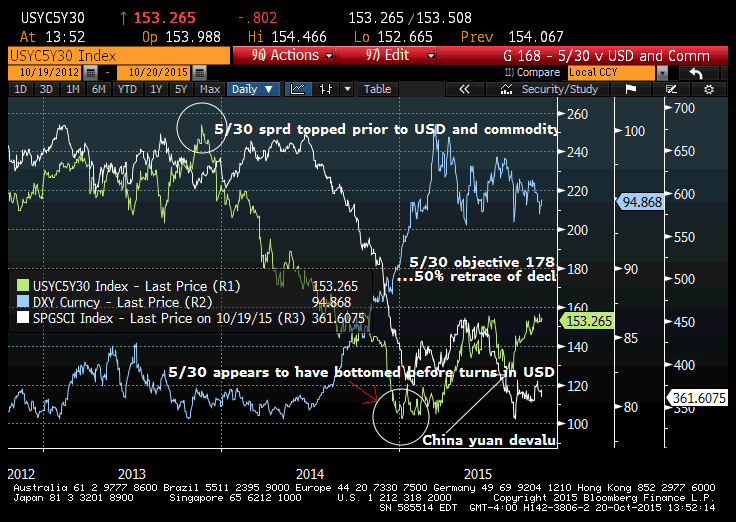
Below is a chart of the 5yr to 30yr US treasury spread. On Tuesday the spread was trading near the highs of this calendar year, at 153.5. There have been three highs around this level, 154.3 in May, 155.3 in early July and 156.4 earlier this month. The previous big move down occurred between late 2013 and the first quarter of 2015, with the spread moving from 254 bps down to 103 bps. Halfway back would be around 178 bps, which is my target level.

What does this spread signify? A steeper curve, e.g. a higher 5/30 spread, is indicative of an increase in term premium for longer maturities, and also increased inflation expectations. Other market based indicators of inflation, for example, the ten year treasury versus the inflation index note spread, and the five year five year forward inflation index swap are not really showing signs of increased prices.
However, I have found that over recent history, the 5/30 spread is a leading indicator. For example, the spread topped in November of 2013 at 254. However the big rally in the US dollar which was simultaneously associated with the plunge in commodities, began much later, in June of 2014. Similarly, 5/30 appears to have bottomed in early Jan of 2015, while the dollar index topped in March and commodities (perhaps) bottomed in July 2015.
In August of this year China devalued the yuan. It was at that time that the spread retraced lower to 125 bps as the move was expected to result in Chinese exports being much more competitive on world markets (i.e. deflationary). However, the spread rebounded to the current level over 150, and is threatening to burst through the triple top. The fact that the Fed passed on a chance to hike at the September FOMC also contributed to curve steepening.
Are there other factors boosting the spread? One reason might be the fact that other foreign central banks have been selling reserves, including longer dated treasuries, to support their own currencies. Additionally, since QE ended in the US about a year ago, US corporate debt yields have increased relative to treasuries, pushing yields on both asset classes higher.
The point is that the curve may be foretelling firmer inflation data in spite of lukewarm economic data. The dollar index has likely already topped, and the broad asset class of commodities has likely bottomed. Perhaps if Fed officials can simply keep their comments to a minimum, their objective of seeing somewhat higher inflation levels will transpire naturally.


