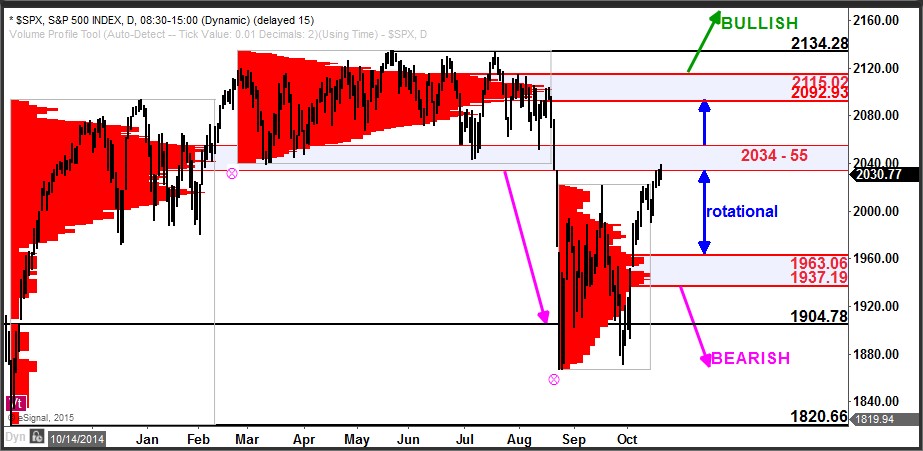
The S&P 500 has rallied into a key area of resistance. This zone of resistance is the former support zone that held the market up for more than 6 months earlier this year before its breach that led to the ‘mini-crash’.
This zone of former support, now resistance, is 2034 – 2055. This is a zone where I expect to see renewed selling interest and anticipate to see selling pressure return.
There is nearby support at 2020 as well as 1991. A decline that breaches these levels would be the first signal that a correction is underway. Lower support is established at 1937 – 1963 and the near-term bias will remain rotational while above this support zone.
If the index breaks above 2055, higher resistance is at 2092 – 2115. Only a move above this higher zone of resistance would signal that the index has regained a bullish bias in the big picture. Conversely, if the S&P declines back under 1937, that would be a signal that the bears have reclaimed the upper hand and a continuation to the downside would be expected.
If you’d like to learn more about how to read the stock market and use volume at price information, click here: http://www.volumeatprice.com