
Even though gold appears to have made an important low, we do not expect the next year to deliver a big, trending move like those of 2012 and 2014. However, our forecast shouldn’t discourage traders from entering this market with a “rangebound” approach.
Since gold has rallied from near our Gann square-of-nine target of $1,064, we believe the five-wave i-ii-iii-iv-v diagonal pattern is complete. Also, the whole diagonal formation served to complete the larger set of patterns which comprised the entire move down from the 2011 price high.
That means we would expect a corrective pattern to develop next, and it should be of a magnitude proportional to the main elements of the decline since 2011. In other words, the next price moves should be choppy on a big time frame while also being nicely tradable on weekly and daily charts.
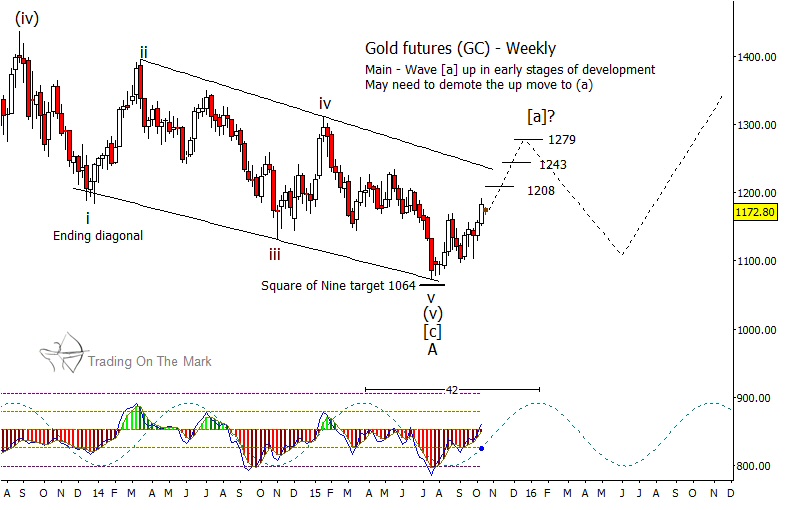
On the weekly chart above, we have drawn the most prominent resistance targets for the present rally. Traders working on a daily or weekly time frame might consider trading long on any pullback until at least one of those targets has been hit. We believe the resistance near $1,243 is the most likely target, but the 42-week price cycle may lend additional warning that the current upward move is reaching exhaustion.
There should be opportunities for short trades later, when the price cycle moves into its next downward phase starting around the turn of the year. When the cycle turns upward again around May or June 2016, it might be possible to fish for long entries. Based on our current analysis, we expect those cycle swings to correspond to waves [b] and [c] as counterparts to the current wave [a].
To put the rangebound expectations in context, traders might wish to view the bigger-picture monthly chart posted at our website. It shows higher upward targets for the [a]-[b]-[c] formation, and it also shows how the corrective pattern may be followed by another strong downward move in 2017.

