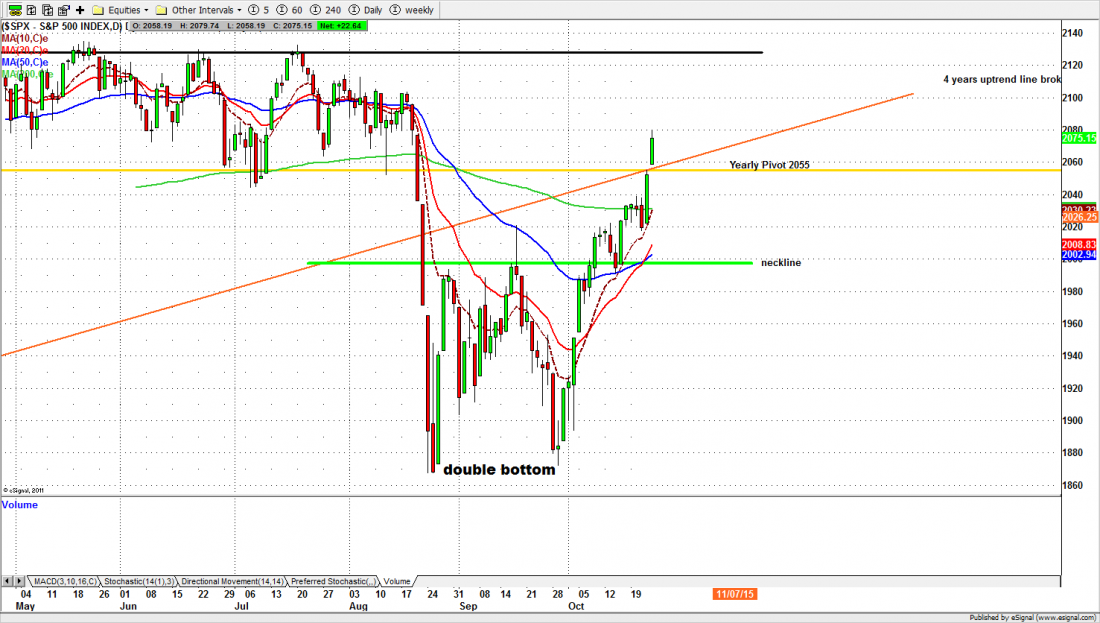
The S&P500 cash index (SPX) closed at 2075.15 Friday, up 42.01 points for a 2% net weekly gain. It not only held above the 200-day moving average, it also managed to close above the four-year trend line, the previously solid support shattered in the August crash.
Take a look at the chart at the bottom of this article. Since the end of September the SPX has made a double bottom around the 1870 level and come roaring back roughly 210 points in just under 20 trading days. We are now back to where the market traded at the end of July,,, as if that heart-stopping waterfall in August never happened.
All this despite weak economic data, disappointing corporate earnings, and a global economy that looks more fragile every day.
A lot of that miraculous recovery is a testament to the power of perception over reality, as manipulated by the world’s central banks.
In the US the Federal Reserve and in Europe the European Central Bank have managed to reverse what could easily have been the precipitating event for a Bear market … and they have done it using little more than press releases and public statements. We are all witnesses to the power of the Word.
Will it work this week?
Probably. The key event for US market this week will be the release of the Fed Open Market Committee minutes on Wednesday. They won’t reveal any hard-and-fast decisions (they never do) but traders will be counting the semi-colons and parsing the adjectives, trying to find something – anything – to goose the markets higher.
Despite that, we’re expecting some kind of consolidation to take place this week; not necessarily a retracement, but a slowing of the riotous skyrocket of the past few weeks.
The price level we are watching is 2093, the high for 2014, reached just three days before the end of the year. Ten months later, it will present a test for the S&P500.
What happens around 2093 is significant for the technical interpretation of the current market. Technicians are undecided: the current moves could be a Bull rally in what is possibly the beginning of a Bear Market.
Or it could be primary Wave 5 of the old Bull market, on its way back beyond May’s high. We’ll be watching for clues if/when the market reaches 2093, and reacts to the resistance there.
Today
For the S&P500 mini-futures (ES), the instrument we use to trade the index, Friday formed a sort of hidden doji on the chart; the futures gapped up overnight, but during regular trading opened and closed at 2066 — in effect a gap up followed by a 20-point doji. That’s a hesitation pattern.
After the market opens today (Monday) we’ll be watching to see which direction the ES breaks. A move above 2079.50 could push the price up to 2088-89.50 or higher up to 2094, the unfilled gap created on Aug. 18.

But the ES could also go down to fill last Friday’s unfilled gap 2053 or lower to towards 2050-2045 if the ES fails to move above 2075 and instead breaks below the 2056.50 line
A minor pullback in early sessions should be expected. But we will continue to see “Buy the Dip” behavior which could slow down the pullback.
Major support levels: 2039-35.50, 2027-25.50, 2016-14, 1995.50-96.25, 1940-33.25
Major resistance levels: 2093.75-96.50, 2114.50-16.50, 2134-35.50
For detailed market analysis from Naturus.com, free of charge, follow this link
http://www.naturus.com/mailing-list-signup-page/


