This is the third TraderPlanet article I’ve written on the Dow where I want to again revisit an original analysis provided by volume-at-price information far in advance of the index reaching or responding to the levels cited.
The Dow has rallied more than 1000 points since the beginning of September when the original volume at price analysis was done. The index has rallied these 1000+ points with just a single pause. The single pause came at the first resistance zone which was identified more than a month prior to the index reaching it.
The index is now just shy of the second resistance area from that original article. The details are republished just below and this speaks to the robustness and consistency of volume-at-price analysis. The analysis as originally published remains applicable and timely even today.
From 9/8:
Each of the stock indices, the Dow included, hit key levels of support on the sharp selloff last month. Now that the stock indices are bouncing, the big question is, “What’s next?”
There’s no ambiguity in my opinion on this matter. The stock indices are bouncing to another opportune selling area and will continue with a new downside push once we’ve reached these zones.
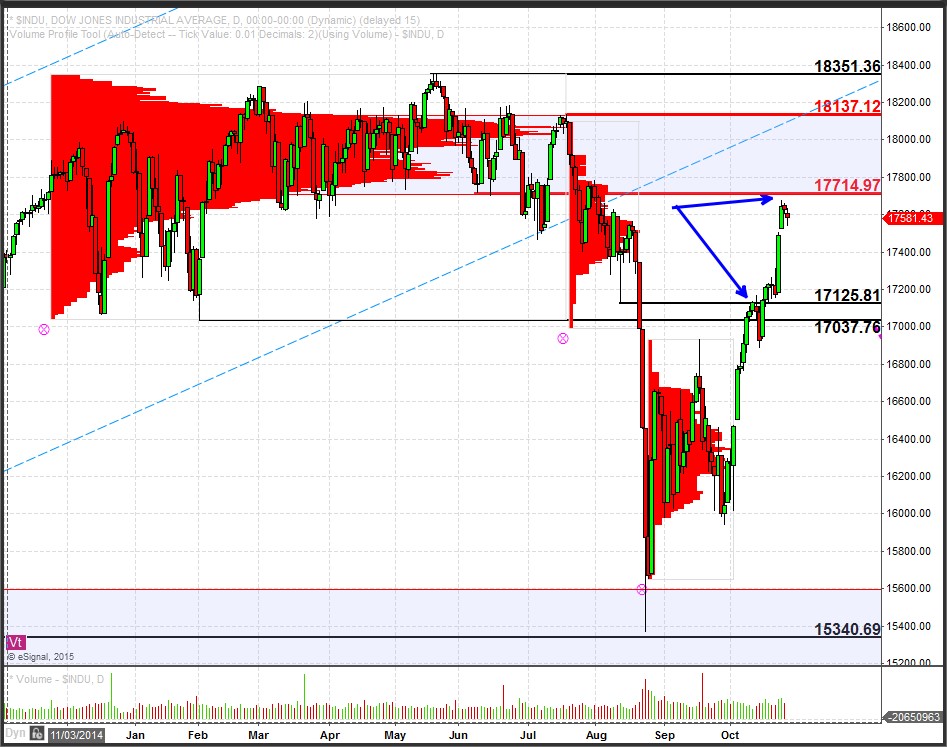
In the Dow Jones Industrial Average, the first area I expect selling pressure is at the 17,037 level, which was the low of the year for the first half of 2015 and was a breakdown level. If by chance the Dow could manage to push above this level, the robust area of resistance beginning at 17,714 is a prime selling opportunity, if only the index manages to reach it.
If you’d like to learn more about how to read the stock market and use volume at price information, click here: http://www.volumeatprice.com