Like any professional field, trading and investing have a unique language all their own. Yet, much of what we learn from the words used are simply basic structures that explain economic conditions such as supply and demand curves. We can determine fair pricing based on current and future expectations.
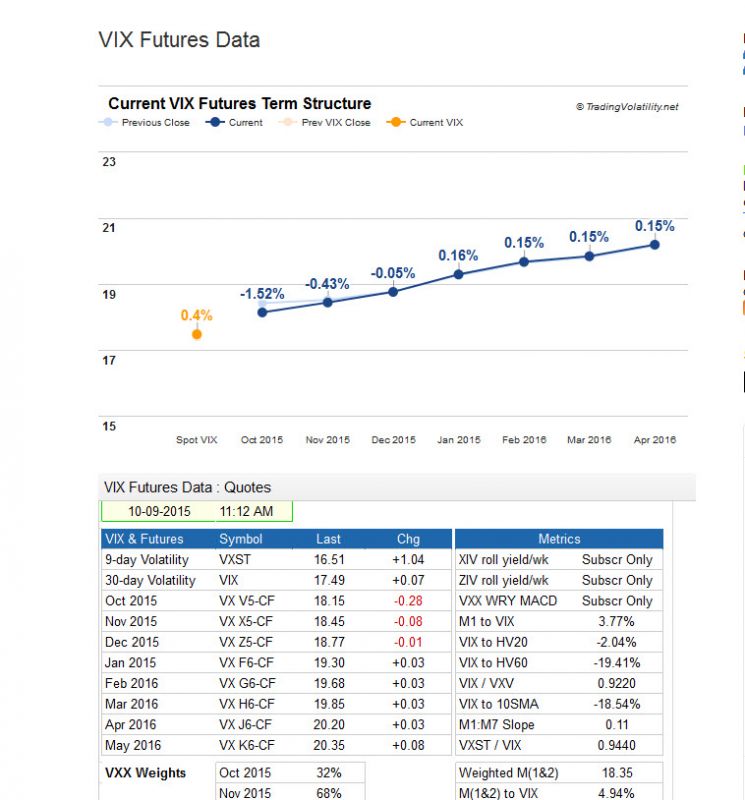
When plotting data on a graph with price on the vertical axis and time on horizontal axis we come up with a graphic that portrays futures prices in time. One would expect price to rise the further out in time we go, and that portrays a normal bullish construct, or contango. By definition, this where the futures (or forward) price is greater than expected spot price. Those who are short benefit as the futures price ‘should’ eventually fall to the spot level. When a market is bullish this is a condition that exists when supply is plentiful and forward expectations are clear. Contango conditions can be seen in futures, commodities, bonds, stocks, volatility, metals and crude.
Below is a graphic showing the VIX futures in contango (10/9/15). The stock market was in bullish mode as the VIX is a contrarian indicator.
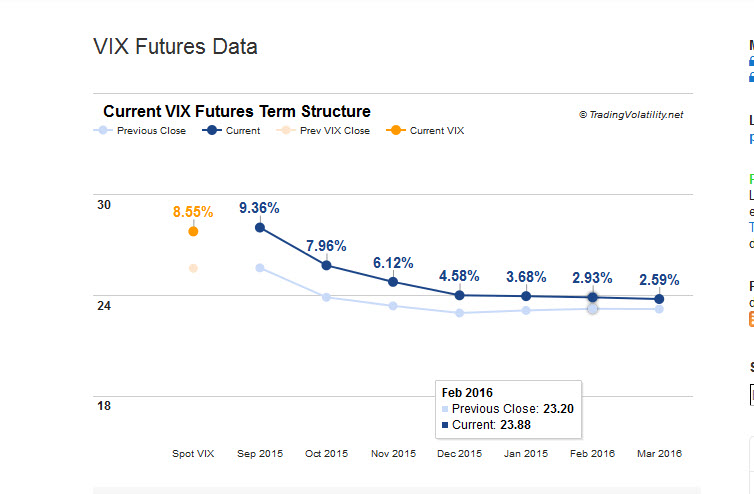
On the other hand, when spot prices exceed futures then there is a supply problem out into the future and short term prices are lifted well above forwards. Who benefits in this condition? Those speculators/traders who are net long and want to see their positions rise. This is often seen as a bearish condition when short term supplies are tight future price expectation is murky.
Below is a graphic showing the VIX futures in backwardation (9/6/15). The stock market reflects the inverse of the VIX action, as it started to portray bearish conditions.