

The Non-Farm Payrolls report – the monthly snapshot of the condition of the US labor market – always has an exaggerated impact on the stock market.
We’ll find out today and the rest of this week if it has enough clout to slow down the raging buying panic that has sent US equities racing to the moon, Alice.
There is a lot to quibble about with the NFP (and we will quibbling enthusiastically in a subsequent post) but even the harshest critics will concede that the report released Friday morning was a doozy: lots more new jobs created than anyone expected, hourly wages went up, for a change, and the unemployment rate went down.
Even if you don’t accept all of this at face value – and we don’t – the results are much, much better than anyone predicted. And that’s the problem.
The Federal Reserve would like to raise interest rates, if for no other reason than to demonstrate that all their posturing over the past nine months was not just hopeless blather.
One of the things stopping them is the fear that the green shoots of recovery they claim to detect in the US economy are not being reflected in the US labor market.
But now they are! Look at all the new jobs this recovering economy has created! They are right there in the Non-Farm Payroll report.
More and better jobs is good for the economy and eventually good for the stock market. But the prospect that the Fed may now be able to raise interest rates is bad for the stock market. Very bad.
So traders don’t know whether to cheer or cry. That indecision was reflected in the market activity Friday, and will be affecting the next moves today and the rest of this week, as traders try to decide if this is good news or bad news.
The large-cap index, the S&P500 (SPX) has rallied ferociously for the past six weeks. It closed Friday at 2099.20, just a bit below the psychologically-important 2100 level.
It hasn’t ended a week at that level since the beginning of August, and the SPX has now regained everything that was lost in the August crash.
Sentiment is strong. The uptrend is intact. Long-term, we probably go higher from here.
But before we get to that bright new world of higher highs, we’re due for a little retracement, and the doji patterns formed in the last two trading days may be the start.
What to watch for
For the SPX the 10-day moving average line at 2080 will be very important this week. It overlaps the four-year uptrend line.
This long-term uptrend line was broken once in August and generated momentum to the downside. A break below it now could repeat that pattern if the price also breaks down through the 20-day moving average and the yearly pivot level at the same time.
The neckline of the double bottom is in the 2030-2020 zone. That will be short-term major support. The index may drop to test the neckline zone if 2080 fails to hold up.
Alternatively, we may instead have a series of teases – small retracements that quickly reverse.
Futures
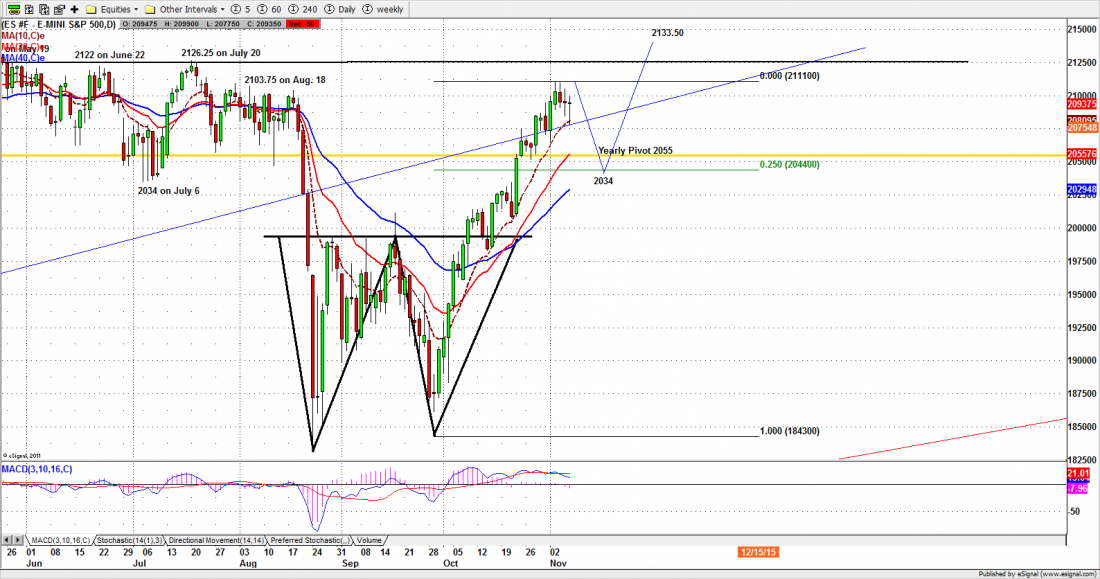
The S&P500 mini-futures (ESZ5) is the vehicle we use to trade the index. Friday it gave a small reversal signal which was not confirmed by the closing price. Today and tomorrow we’ll be watching to see if the ES can move below 2073 and close there. That would confirm a short-term retracement.
If it doesn’t happen, we will probably repeat Friday’s range, or move up to 2110-2114 to retest the recent highs. The longer-term trend is up, and a small retracement won’t affect that. But in the short time frame the market is extremely overbought and this may be the week it stalls a little.
Major support levels: 2039-35.50, 2027-25.50, 2016-14, 1995.50-96.25, 1940-33.25
Major resistance levels: 2103.75-02.50, 2114.50-16.50, 2134-35.50
For detailed market analysis from Naturus.com, free of charge, follow this link
http://www.naturus.com/mailing-list-signup-page/
Chart: ESZ5 S&P500 mini-futures. Daily chart, to Nov. 6, 2015

