The US large-cap index, the S&P500, closed at 2077.19 yesterday for a loss of a little more than 1 point from the previous close. That’s pretty much the definition of a market moving sideways.
That’s the good news. The bad news is that the index has turned down from the high it made last week at 2116.48 and has drifted into a sort of slow-motion slide sideways.
We aren’t seeing anything of the astonishing momentum that drove the markets relentlessly higher in October. Instead this looks like consolidation time, at least for a while.
The same desultory movement was apparent in the S&P500 mini-futures (ES) the vehicle we use to trade the index. It closed at 2078, up slightly from Monday’s close, but still well below last week’s high.
It isn’t a rout; just a sense of fatigue, as if traders are deciding that it just sounds like too much trouble right now.
We’ve had six Fed officials speechifying in the last few days, and more scheduled today and the rest of the week. People have stopped paying attention … until the next bomb explodes.
Today
ECB president Mario Draghi will give a speech at 8:15am New York time, and there may be something there to rouse the market from its torpor. But the most likely outcome for today is a repeat of yesterday.
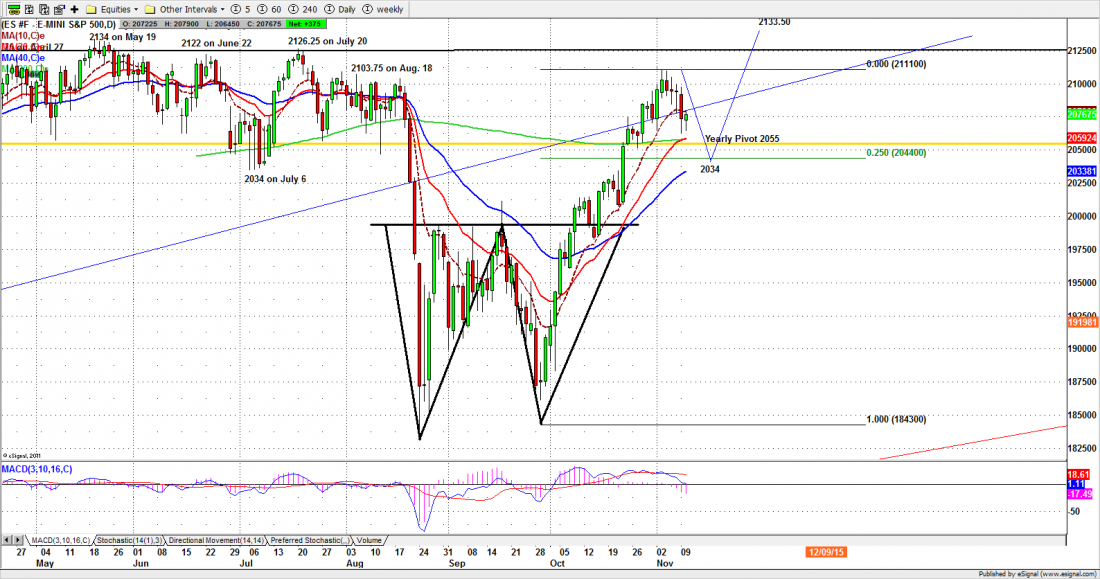
Yesterday the ES just went sideways between 10-day and 20-day moving averages. The 20-day EMA line overlaps 200-day moving average, which gives it additional strength as a support level. If that support wasn’t broken in overnight trading, it will probably hold up today.
On the upside, Monday’s gap at 2093.75 will likely remain unfilled today. The 2084-85 zone needs to defend this unfilled gap and prevent ES from popping up further.
On the downside, 2062.50-64 will remain an important support zone for today. As long as ES doesn’t go under 2062, the buyers will continue to enter at the support zone and push the price back up again.
Today is Veteran’s Day in the US, Remembrance Day in Canada: Let’s take a moment to remember what they did for us.
Major support levels for Wednesday: 2064-62, 2052-54.50. 2035.50-32.50, 2025-23.75
Major resistance levels: 2114.50-16.50, 2121.75-23.50, 2131.50-29.75
For detailed market analysis from Naturus.com, free of charge, follow this link
http://www.naturus.com/mailing-list-signup-page/
Chart: ESZ5 S&P500 mini-futures. Daily chart, to Nov. 10, 2015