

More than comparable indices, the London FTSE may have tipped its hand to reveal intentions for 2016. Whereas the S&P 500 and the German DAX have not broken beneath their October 2014 lows, FTSE has moved convincingly into that territory. Also, although the Dow Jones Industrial Average has joined FTSE in making a new 2015 low, FTSE has failed to join with the Dow’s strong rally in recent months. We believe FTSE offers one of the cleanest counts foretelling a bearish market for next year.
The weekly chart below presents a fairly detailed Elliott wave count that meets the structural requirements for the early 2015 high to be a terminal high. That conclusion is reinforced by the way the index struggled and failed to overcome multiple types of resistance during the early weeks of this year. When the upper edge of the channel proved too difficult to break, the easiest path changed to a downward one. Now we are provisionally counting downward from the high.
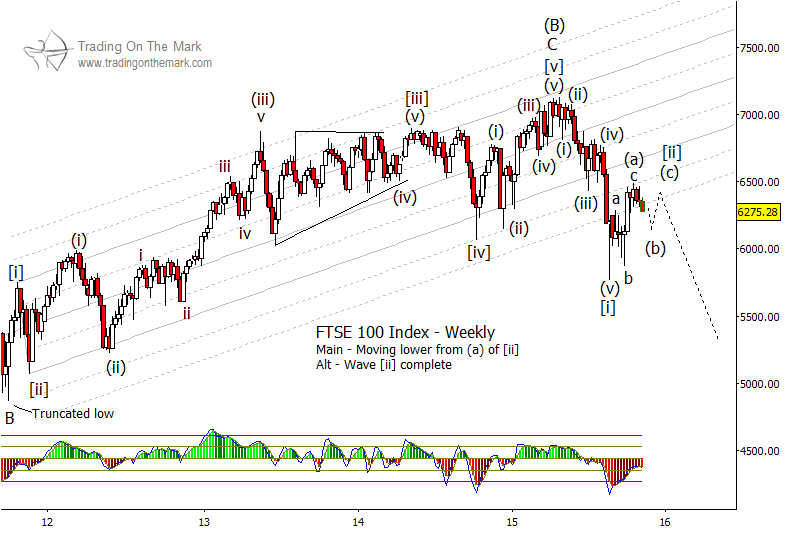
Counting downward, FTSE traced a five-wave impulsive move into its summer 2015 low, followed by a three-wave corrective move upward. While it is possible that the upward correction is finished, we believe it is more likely to be merely the first part of a correction, as we have drawn speculatively on the chart. That scenario would allow the market to hold within a range until there is more news from the December meetings of the U.S. and European central banks.
Even if the current wave [ii] correction has farther to go, it does not necessarily have to make a higher high compared to the one in October. A lower high for wave (c) of [ii] is not uncommon when an index is in the process of breaking out of a channel.
If this type of analysis is helpful in your trading and investing, let us know that you’d like to receive an occasional newsletter. It offers big-picture analysis and perspectives delivered to your inbox every few weeks.

