

Here at K Capital, we’ve been swing trading based on technical analysis for years. We consistently find swing trades that fit our strategy of meeting specific conditions and patterns that provide the perfect opportunity to capitalize on potentially huge moves. Are we always right? No, of course not. But we’ve been correct enough times that our track record speaks for itself.
Why does that matter?
In our experience, one thing never changes with new traders or sometimes even experienced professionals. New trader after new trader will join the markets looking for the ‘holy grail’ of technical analysis…that one indicator that will pave the way to their riches and financial freedom.
Stochastics, MACD, RSI, Histograms, moving averages, exponential moving averages, Fibonacci, oscillators, leading indicators, lagging indicators……you name….we’ve traded it.
What have we learned?
That Volume is hands down the most accurate, timely and robust of all indicators!
Why?
Because it can’t lie!
Every other indicator lacks what volume almost always tells you as a trader looking for a potential new position. Volume outlines the demand and supply, the underlying driver of why a stock is moving, and most importantly, the probability of what the equity or underlying position will do next. Without volume a stock is dead. The perfect setup can only go so far without volume supporting the next step.
When volume trades at specific levels, and in certain technical patterns, we can more clearly identify the areas at which demand (buying) is highest and supply (selling) is weakest.
Scanning for differences in volume patterns and changes in the day to day averages can tell you more about a stocks potential than any other indicator.
At K Capital we provide countless examples of this timeless story on our site, but below is a clear cut example of how volume can be so important and lead to huge returns.
Take $EMKR as an example…
Fundamentally, $EMKR has a host of reasons this will see $10 within the next few weeks. New, higher sell-side analyst targets released just this week with price targets of $10+, increasing margins, reduced operating costs, increasing revenues quarter over quarter and under-valued EBITDA multiples are just the tip of the iceberg. But the one thing that caught our eye, and continues to catch our eye, is the increasing volume spikes on huge green candlestick days.
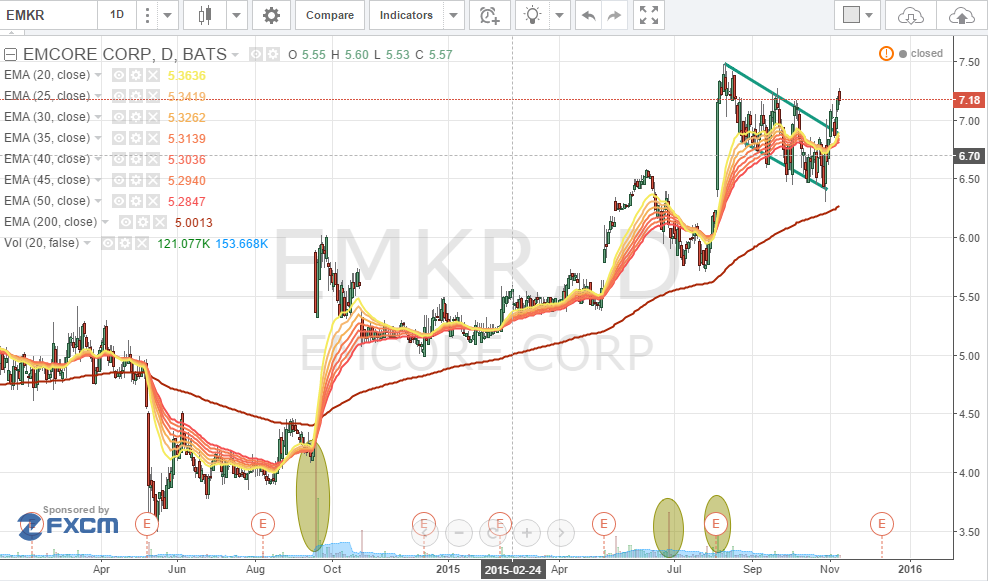
Once $EMKR broke the 200ema the trend was set and we watched as specific volume patterns matched our buy criteria through the last few weeks. Once we had confirmation that volume was perfect for a long we waited for one of our signature patterns to develop. At that point we went long, and as of today (11/10/2015) we continue to expect $EMKR to make new highs soon. Our current price target is $10 which is ~30% higher from today’s levels.
Learn more about our volume strategies, technical patterns and packages at K Capital Advisors.com

