

On November 3rd, I wrote an article titled “expect a down week in the SPX” because investor sentiment was stretched on the bull’s side. Since 11/03/15, the SPX has dropped about 100 points and has been following a fractal pattern to a T, which now is supporting a rally into early December. A fractal pattern is a repeating pattern and if followed exactly, gives you a very good idea as to what to expect in the future.
The time period for the fractal pattern was December 2014 and now. As you can see in the chart below, the similarities of the pattern are almost perfect.
SPX December 2014: Fractal pattern
1.) SPX made an important panic low “Black Hole” in October and rallied straight up for 7 weeks
2.) Investor Sentiment saw a series of extreme bullish sentiment readings
3.) The NYMO (NY McClellan Oscillator) started reversing as the SPX was trending higher
4.) The MACD on the NYMO chart crossed to the downside
5.) The SPX traded down and lost 100 points
SPX Now 2015: Fractal pattern
1.) SPX made an important panic low “Beige Hole” in late September and rallied straight up for 6 weeks
2.) Investor Sentiment saw a series of extreme bullish sentiment readings
3.) The NYMO (NY McClellan Oscillator) started reversing as the SPX was trending higher
4.) The SPX traded down and lost 97 points
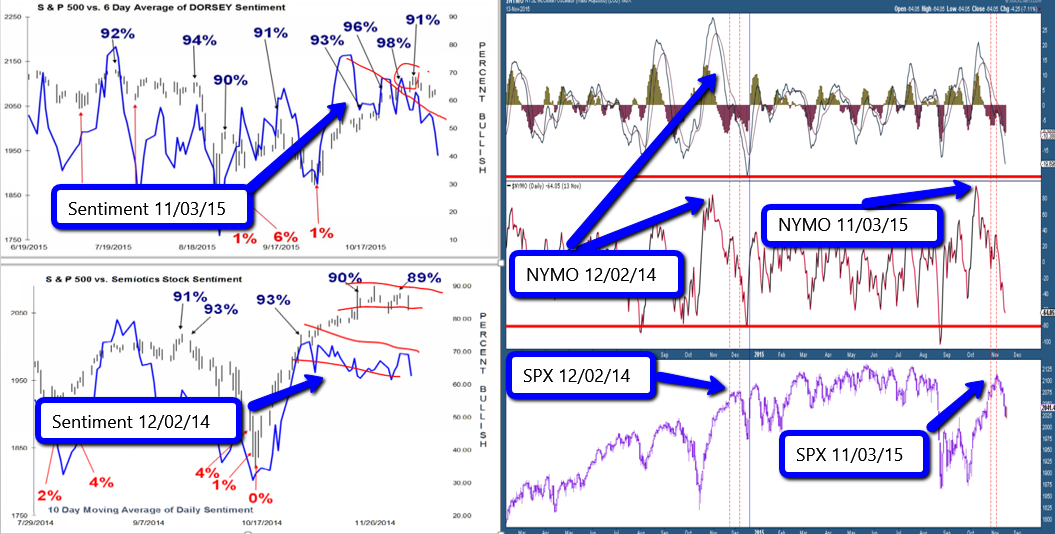
What is the fractal pattern suggesting now? If it continues to follow the pattern, then we should see the SPX make up most of the 97 points lost in the first 3 days. As I am typing, it is trading +29, so it has already made up almost a 1/3 of lost points. Sentiment has collapsed-showing just 1% bulls (everybody is bearish) and the groundwork has been set for a rally-which looks like it already started. Be careful on the short side. We should rally into the next turn date.
Tap here to get the next turn date Free

