The financial landscape is much different than it was in 2007 leading up to the financial crisis. However from the perspective of the S&P 500 price action and the VIX, there are some parallels that are worth keeping sight of.
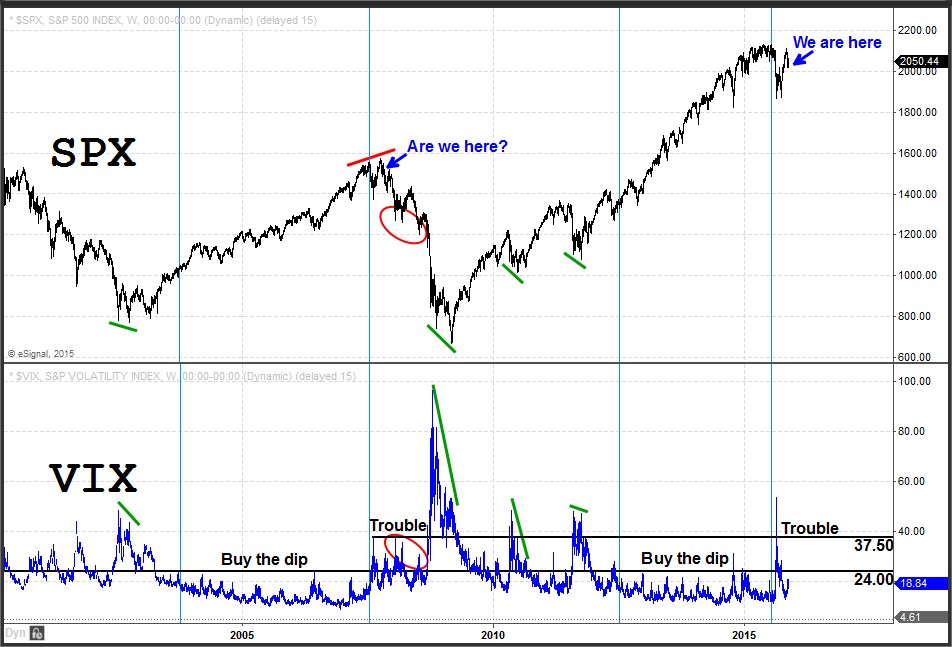
As you can see on this chart, we are one rally beyond the big VIX spike in August. The period prior to the downturn in 2007 is the comparison I am measuring the current price action against and I’ve indicated what would be a similar point then.
The most recent spike in VIX, which came after a prolonged period of low VIX readings (sustained below 24), is similar to what we saw in late 2007. The ‘buy the dip’ environment ended after that initial spike in VIX but the S&P did not head lower right away and even went on to a slight new high with the VIX returning to readings in the 15’s before heading downward in earnest. The latest rally in the S&P did not carry to new highs thus far but VIX readings did come back to 15 and just below.
If there is renewed decline (a breach of 2007 – 2034) accompanied by the VIX rising back to the 30 level, this would suggest that there is further trouble ahead. If the S&P 500 is able to rally back to an area where the larger bias shifts to bullish (above 2115) and the VIX maintains reading below 20 (and especially below 15), this would signal higher prices dead ahead.
If you’d like to learn more about how to read the stock market and use volume at price information, click here. http://www.volumeatprice.com