

The 200 exponential moving average is one of the most important and telling indicators when swing trading for multiple day to week holding periods. One of the most significant lessons we’ve learned here at K Capital Advisors, and what we teach through our alerts and educational videos, is that trading against the 200EMA trend always ends poorly for swing trades. If you’re timeline is above and beyond a day-trade (i.e. you’re swing trading) this rule can be summarized quite simply:
Never go long when a stock is below the 200EMA.
Never go short when a stock is above the 200EMA
Taking this general rule of thumb, we can apply the rule to both the overall market as well individual positions.
This is the first step in analyzing the technical indicators and price levels of positions.
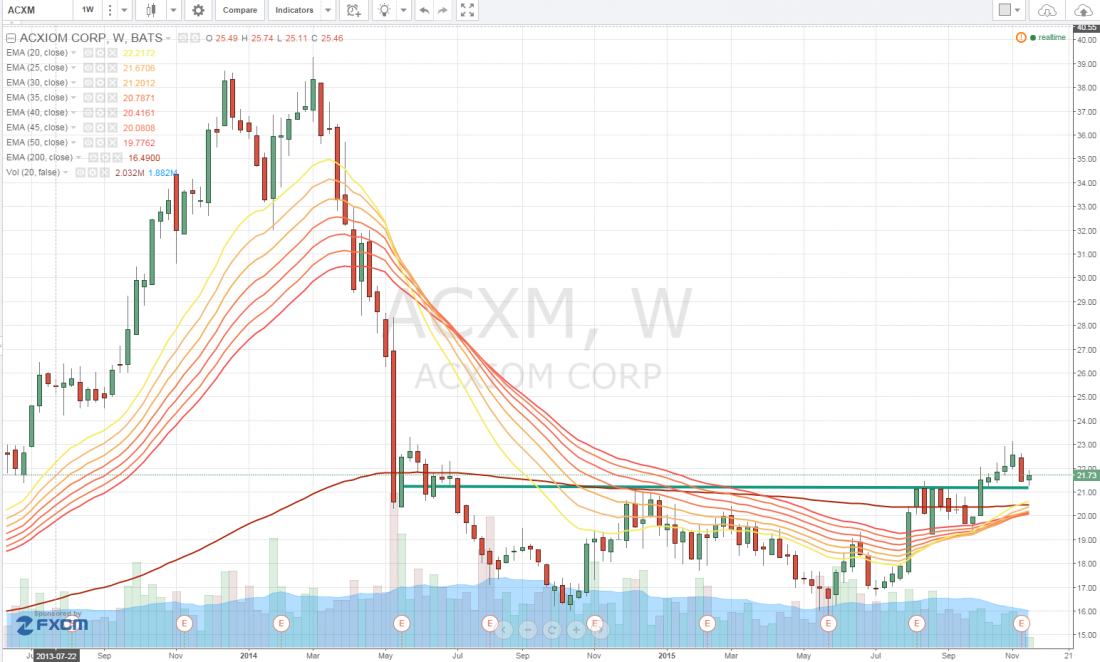
One such position that fits this mold (among other indicators and patterns we teach), is $ACXM or Acxiom.
When beginning to analyze any potential new position we always examine the equity from a weekly and daily chart standpoint and then break down the intraday charts for specific entry points.
Looking at $ACXM we can see an almost perfect long term break out play is occurring right now on the weekly chart. Long term resistance at $21 was surpassed on heavy, above average volume which shot the stock above the 200EMA back in August.
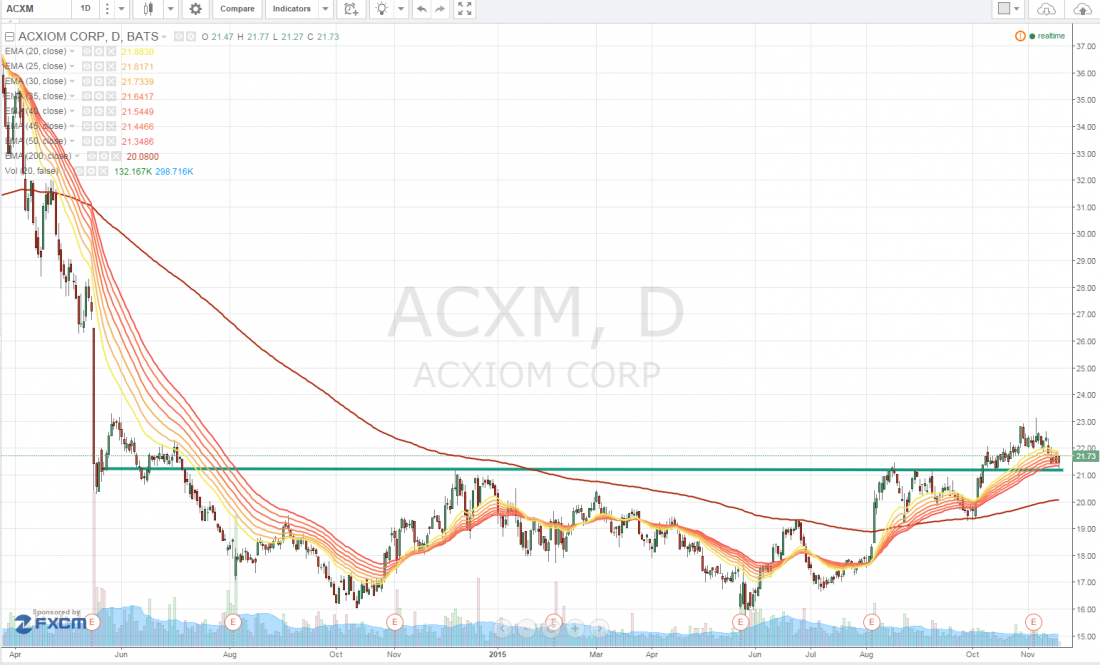
From there, the daily chart offered perfect areas of support to go long and add to a trader’s position.
Now, we’re seeing a continuation in the pattern as volume continues to come in and the trend continues to hold.
We’re long with an initial price target of $25 or 20% above today’s closing price.
The trend is always your friend, traders.
Learn more about our volume strategies, technical patterns and packages at K Capital Advisors.com

