I’m a trading coach, but I also like to trade leading large caps such as Netflix and Apple for my own account. I’ve written several articles offering targets for these two stocks over the last several months. The last article on AAPL, published on 11/2, set a short-term downside target of $115.
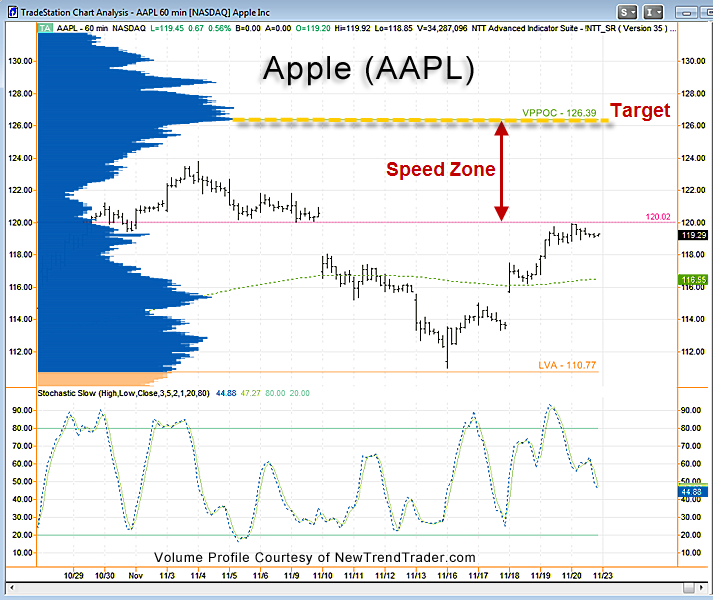
As you can see from the accompanying chart, AAPL made it all the way down to the line marked “LVA” at $110, which stands for Lower Value Area. This is an area of strong support from a volume profile perspective.
On the way down AAPL formed a gap between $118-$120 that has recently been filled, but not surpassed. The $120 level (pink line on the chart) is therefore a key resistance level. The pattern on the 60 minute chart is a classic ‘Cup and Handle’ pattern, popularized by William O’Neil.
In the 11/2 article I wrote that I expected AAPL to stage a year-end rally and test the gap zone between $127-130. I still favor that view. One factor that supports the rally scenario is the lack of volume between $120 and $126. That makes this area a “speed zone”, which is a zone of little price resistance.
The other bullish factor is the stochastic, which is dropping while price remains flat. In just a few hours it should be nicely oversold.
In other words, if shares of AAPL ‘ignite’ and move convincingly above $120, they are likely to run to the High Volume Node (HVN) at $126 very quickly.
If you would like to receive a primer on using Volume Profile, please click here: www.daytradingpsychology.com/contact