The S&P 500 has spent the month of November oscillating from resistance to support and back again.
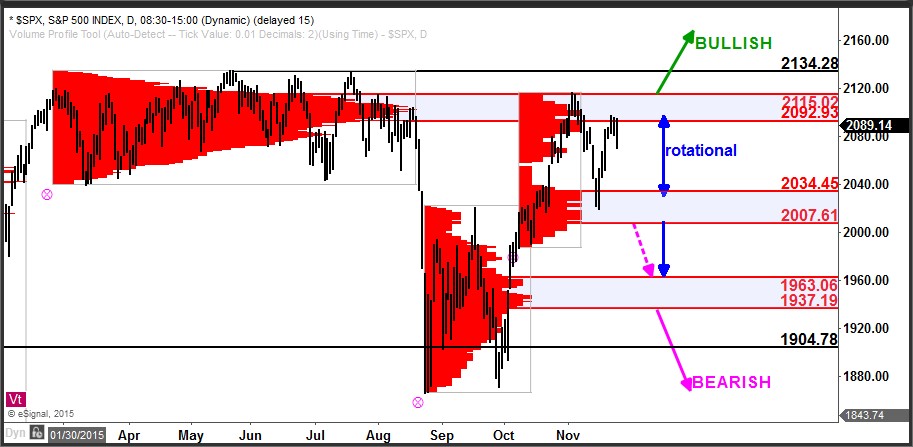
The zone of resistance that turned the index lower as November began is again being tested as we head into Thanksgiving. This high-volume area resistance is at 2092 – 2115 as shown in the chart by the large volume-at-price accumulation from the first half of the year. A move above this resistance zone would suggest further extension and upside gains. A move over this zone would be a signal that the larger degree bias has shifted to bullish.
To the downside, the zone of support that arrested the recent pullback and sparked this latest rally is at 2007 – 2034, as shown by the volume-at-price profile built as the market rallied from the October low. Any move below this zone of support would suggest further decline targeting lower support at 1937 – 1963.
While between these zones of support and resistance, the bias remains rotational and two-sided price action, with traders fading the extremes, is likely. On any move beyond one of these extremes, look for traders on the wrong side to scramble out of their positions and push the index in the direction of the break.
If you’d like to learn more about how to read the stock market using volume at price information, click here. http://www.volumeatprice.com