

The pattern on monthly and weekly gold charts depicts a nuanced trading opportunity similar to the one we described for silver at TraderPlanet last month. The set of overlapping waves that began in 2014 almost certainly represents exhaustion of the larger downward trend. Price should not venture much lower, but predicting the timing of the expected bounce is tricky.
The narrowing range since 2014 fits well as an Elliott wave ending diagonal pattern – the fifth and final leg of the larger (i)-(ii)-(iii)-(iv)-(v) move down from the mid-2012 high. Within that structure, we expect to find five overlapping sub-waves, four of which appear already to be in place. The final leg of the diagonal probably needs to make a modest bounce followed by an attempt at a lower low, as we have sketched on the monthly chart below.
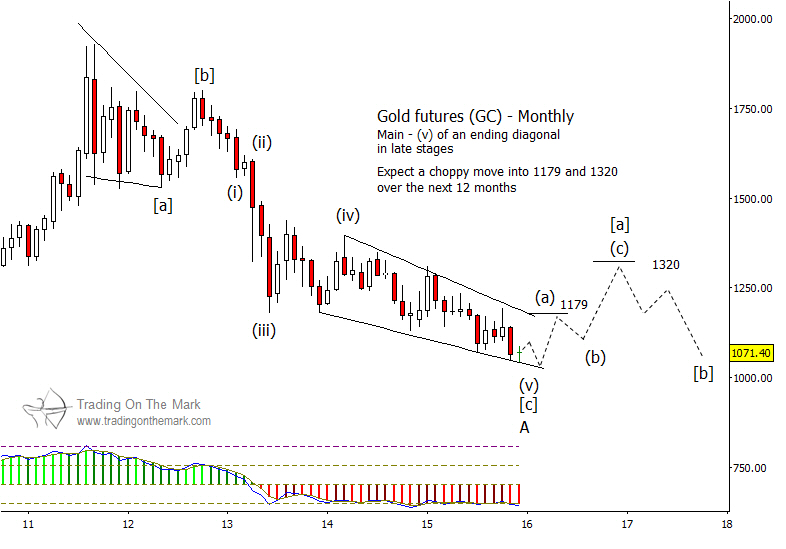
The dominant cycle on a faster weekly chart (not shown) suggests that the ideal time for a low will be in January or February 2016. After that time, gold should begin a choppy move upward to test near Gann-related resistance at 1,179 and later at 1,320. (Those resistance zones are approximate. We will be able to calculate targets more precisely after the ending pattern has put in an actual low.)
Traders who can tolerate some adverse price movement might seek to scale into a position at those moments between now and late winter when price tests support areas near the bottom of the diagonal structure.
Markets are getting interesting this month. Set yourself up to get timely market observations by following us on Twitter!

