As of Monday there are 10 trading days left in 2015, and some of those are effectively dead days when traders take off for holidays in the sunshine, bonuses in hand. So what are you going to sell before the end of the year?
Traditionally investors who are carrying losers in their portfolios – and aren’t we all? – sell them before Dec. 31, so they can write the losses off against this year’s taxes. Often they promptly buy them back early in January, a strategy that usually gives the market a New Year bounce known as the January effect.
But for December, the effect is to pile more woe on the stocks and sectors that are already beaten down. And this year the most likely target of tax-loss selling is the energy sector.
The S&P energy sector index (XLE) is down about 19% for the year, but still holding above the August low, which is something of a miracle when you consider what has happened to the price of crude (down to $36 barrel this week). The decline in the next worse sector, Utilities, is about half that.
That’s not to say the energy stocks won’t get worse before they get better. Some of the major single stocks are down from 40% to 60% and one entire sub-sector – the independents – is off about 35% year-to-date. Of the 19 companies in that subsector, only one is net positive for the year.
The one bright spot is refiners; as the price of crude drops, so do their costs, and that sub-sector is showing a nice gain for 2015.
Normally the last half of December is the time when the Santa Clause rally carries prices higher into the end of the year. But a rally in the Energy stocks is hard to imagine. Hedge funds, institutions and individual investor looking for a loser to dump will likely move the sector lower.
But if you dump it now, should you buy it back in January? According to Nick Colas, the chief market strategist for Convergex, that depends on where you think crude will go in the New Year. But for December, he warns: “Volatility in the Energy sector isn’t over yet, with the calendar for tax loss harvesting set to play a role this month.”
Today
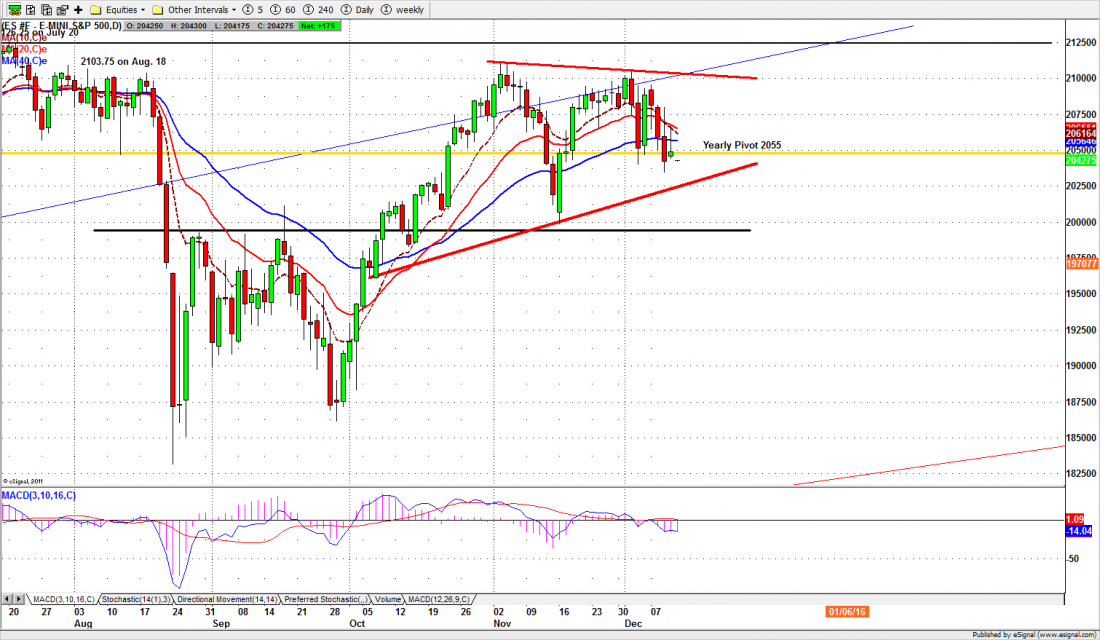
The S&P500 mini futures (ES) change from the December contract to the March 2016 contract today. There will probably be some wide swings as traders finish the roll-over process that began Monday. The difference between the two contracts is about 7.50 points.
Using the December contract, the ES lost the support at the 200-day moving average line, and that support will now become resistance, around 2065-67. The new support area for the old contract is around 2025, the uptrend line of the triangle pattern that has formed on the chart. If that support breaks, we’re looking at 2000-1998 as the next downside target
Major support levels: 2030.50-32.50, 2019.50-22.50, 2006-03.50
Major resistance levels: 2088-89.50 2105-08, 2114.50-16.50, 2121-23.50
Get free Detailed market analysis from Naturus.com here: Naturus market analysis
Chart: ESZ5 Daily chart Dec. 10, 2015