

As a professional trader and money manager, I’ve spent more than 20 years trying to stack the odds in my favor. It began as simply as reading the brokers’ bids and offers in the S&P 500 pit to determine whether the bid or the offer was the stronger side of the market. Moving off the floor in the late 90’s meant developing new tools to read a given market’s balance in order to once again see if the bids or, offers were in control of the market. That search led me to the commercial trader category of the CFTC’s weekly Commitment of Traders Report. This allows me to track the buying and selling of the most knowledgeable traders in any given market. Right now, the Canadian Dollar is providing a textbook example of our employment of this report on both a swing trading and trend following basis. I’d like to share 20+ years of research in one chart and 500 words.
I chose to focus on the commercial trader group because they are the professional hedgers within their market. They focus on their business plan and the market’s current prices to determine if they should be taking action on either side of a given market. They’re value traders. They want to lock in the forward selling price of their estimated production at prices above street value and conversely, purchase the required raw material inputs necessary for future production at the lowest possible prices. An argument can be made as to why I don’t follow the large speculators and commodity trading advisors and there are two primary reasons. First, commodity trading advisors come and go. Their turnover is much higher than a fortune 500 company or large farming or mining operation. Secondly, I’m primarily a swing trader and I rarely hold positions for more than a couple of weeks. This allows me to recapitalize frequently as well as providing more consistent trading opportunities with lower risk per trade.
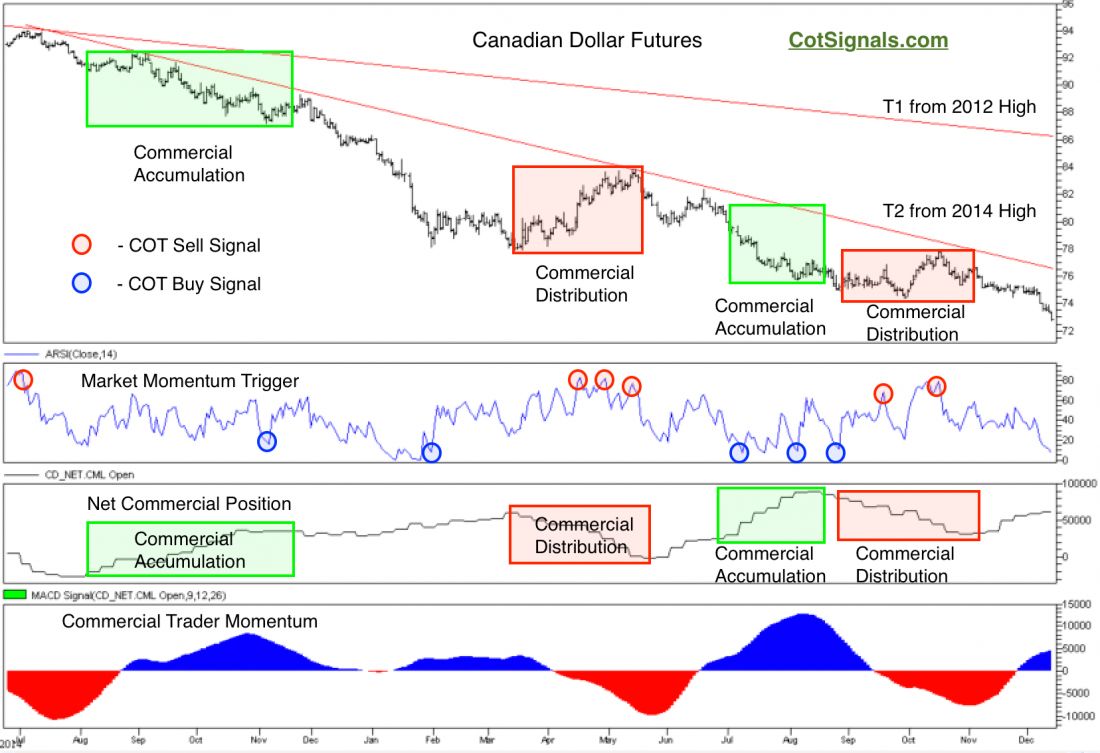
Let’s move to the chart where we see two major downward sloping trend lines clearly indicating that the overall trend is lower in the Canadian Dollar. The green boxes occur during periods of new lows and show commercial trader buying (accumulation) at value driven prices. However, as the trend remains persistently lower, note that commercial buyers begin laying off their value driven purchases as the market consolidates (distribution), only for the market to be driven lower as commercial short hedger selling takes advantage of prices now seen as above the future anticipated value. The pattern of commercial short hedger selling as a market tests its long-term trend is a classic trend following approach.
Meanwhile, the commercial traders’ actions taking place in a short-term context are exactly what the chart shows as the market meanders higher and lower. Commercial buying on new lows, slows the downward trend and creates some reversal pressure to the upside. Meanwhile, commercial trader selling pressure on new highs, caps rallies and turns the market back down towards its midlevel value area. These short-term moves are indicated by the COT trading signals in the second pane of the included chart.
I won’t count this summary in my 500 words. The Commitment of Traders report is a valuable tool for determining which side of the market has the upper hand on both a short and long-term basis. The two main keys are understanding your timeframe and the commercial trader net position within the existing trend. This will help place you on the correct side for short-term swing trades or longer term trends, respectively.
For Actionable Trade Strategies, Learn more at Cotsignals.com

