

Crude oil is testing low levels not seen since 2008. So is crude oil poised for a rally? Or is there even lower prices ahead? What follows is a drill down on the position of crude oil from the big picture down to what to expect in the days ahead.
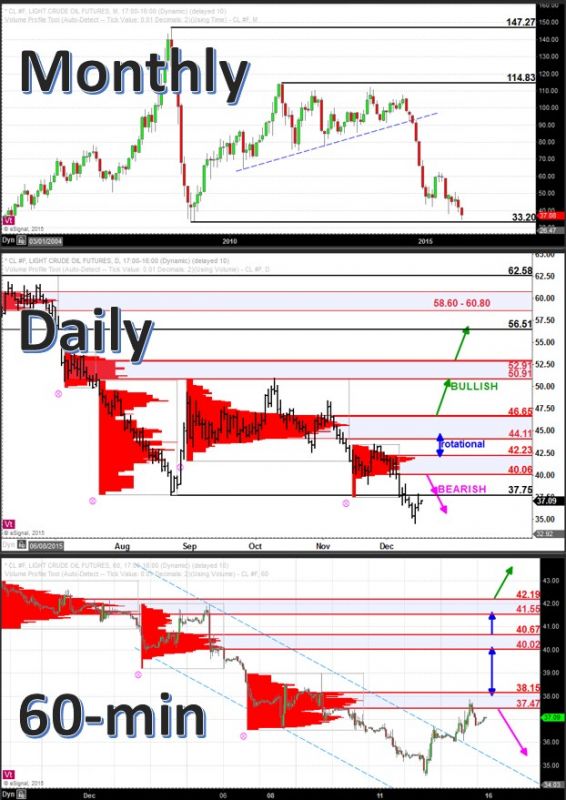
Monthly:
Currently prices are testing the area of the 2008 low, which came in at 33.20. Looking at the monthly chart, this is a historical price marker and an area to look for support and responsive buying.
Daily:
On the daily chart you can see that price remains in a bearish position, retesting the breakdown level at 37.75, which is now acting as resistance. Additionally, the high volume area of resistance above at 40.06 – 42.23 is a zone that must be exceeded to the upside to negate the big picture downward bias.
60-min:
Lastly, looking at the 60-min chart you can see that the rally of the last couple days has broken out above what was a descending trend channel. Price is now testing high volume area resistance at 37.47 – 38.15. This is an area where aggressive sellers are likely to become active again. The bias remains with the sellers while below this zone. A move above this zone is necessary to take the downside pressure off. A move above 38.15 would likely hit stops of recent shorts and would target a move to test higher resistance at 40.02 – 40.67.
If you’d like to learn more about how to read markets using volume at price information, click here: http://www.volumeatprice.com

