The general market performed a slightly delayed about-face after the Fed’s rate hike schedule was announced last Wednesday afternoon. The Fed’s action sparked some hedge fund liquidation in the Nasdaq leadership and the FANG stocks, in particular, are under pressure.
The “N” in FANG stands for Netflix, of course, which is a company I love, but the stock has its ups and downs. The main reason for the volatility is that 14% of the Netflix float is sold sort, which is very high for a market leader. And it’s not just about the 313 trailing 12-month P/E ratio. By way of comparison, Amazon has a trailing P/E of 951, but only 1.5% of Amazon’s float is short.
You don’t have to scour the news to find a reason for Netflix’s drop. Presumably FANG is quite a crowded trade and when hedge funds are leveraged 100:1 they all rush for the exits at the same time.
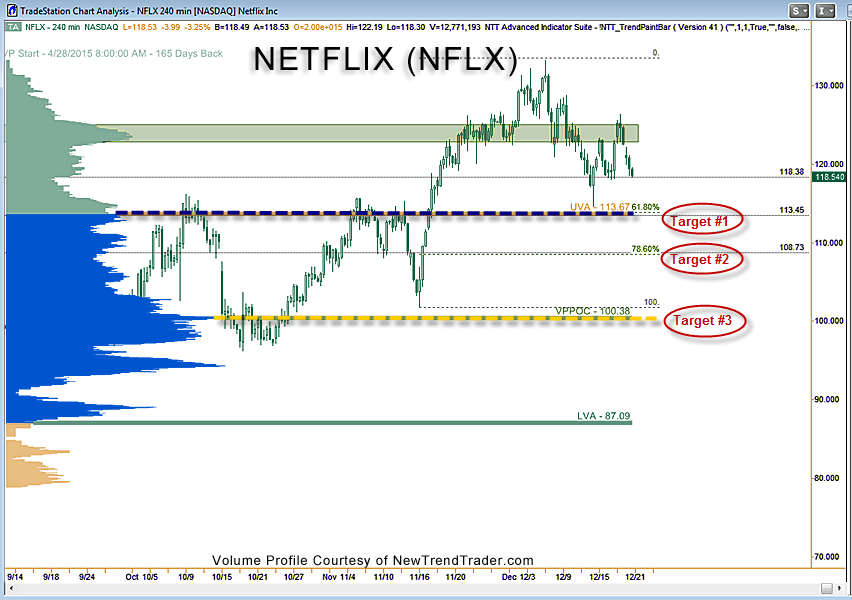
I’ve drawn some support and resistance lines on the Netflix 240 minute chart. Interestingly, these lines correspond to standard Fibonacci retracement levels. This technical coincidence means that a very large group of traders will have the same targets in mind: $113, $108 and if there is an extreme washout, then the Volume Profile Point of Control comes into play at $100. A move below $118 will trigger the slide.
We don’t know yet whether it will be ‘safe’ to buy this dip in NFLX and the other FANG stocks, but the odds favor the bulls until proven otherwise. And with its high short interest, once the market bottoms, Netflix should rally much faster than the other FANGs. The company reports earnings in mid-January.
www.daytradingpsychology.com (Peak performance coaching for private traders)
www.trader-analytics.com (Services for RIAs, banks and hedge funds)