The SPX has been traversing the same ground for the past few weeks as it bumps up against resistance and pulls back only to regather itself and try again.
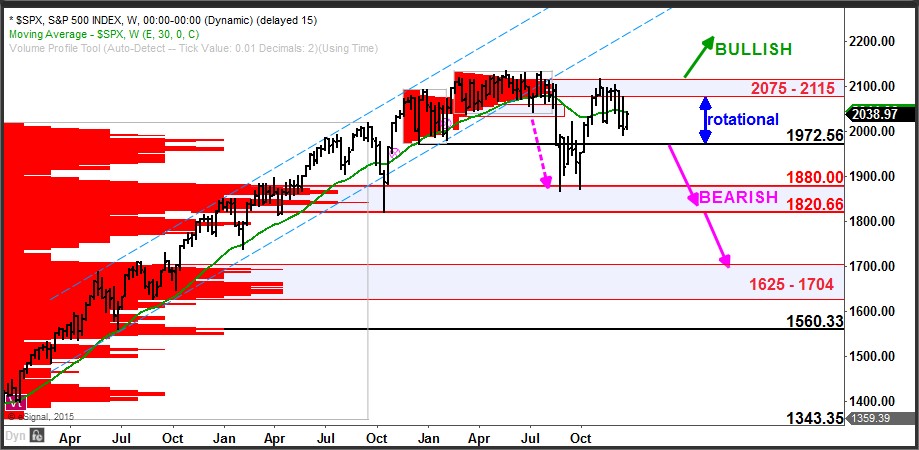
The clear zone of resistance as revealed by the volume-at-price profile built over the first half of this year is at 2075 – 2115. This is the zone that must be cleared in order to put the S&P 500 index in a bullish position.
While below this resistance zone and above 1972, the index biased toward rotational price action and continued consolidation.
If the SPX declines below 1972, this would be a bearish development and shift the bias to favor the bears and a move back to big picture support at 1820 – 1880.
As you can see from the chart, the big picture zone of support at 1820 – 1880 (as defined by the volume-at-price profile built over the course of 2014) has halted declines three times already, first in October of 2014 and then in August and September of this year.
If you’d like to learn more about how to read markets using volume at price information, click here: http://www.volumeatprice.com