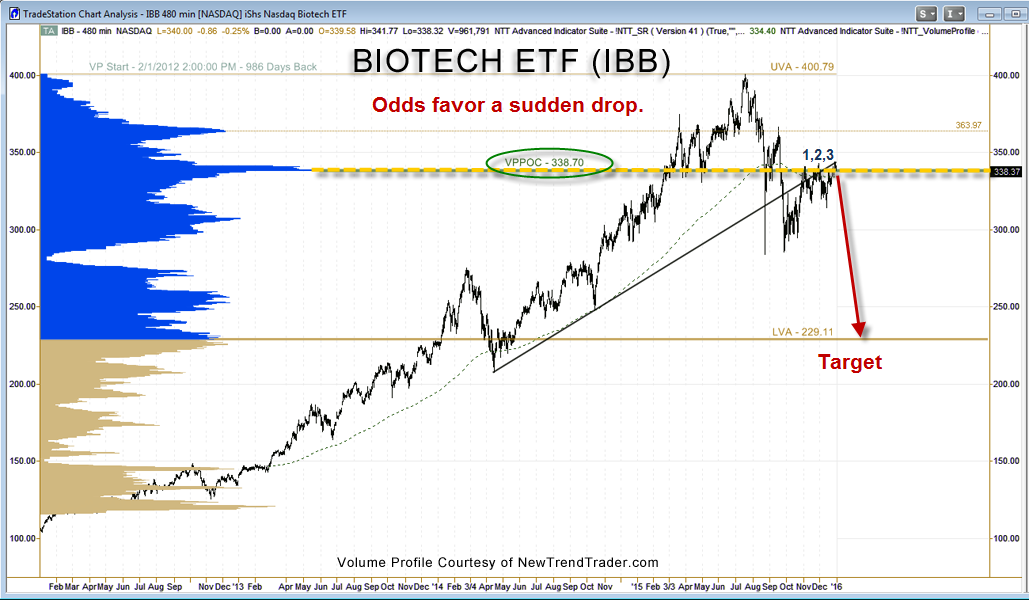
I’ve written quite a few pieces on the impending death of Biotech and so far I’ve been premature. Over the last three months the index has been tenaciously testing its long term Volume Profile Point of Control at $338… but from below. That ‘below’ part is the difficulty for Biotech Bulls.
On the accompanying chart you can see the long blue volume shelf at this key level. It means that historically, over the past 4 years, more volume has been traded around this narrow price zone than at any other price level.
Without a plot of volume-at-price, you might not understand why this level is so important. When price is above the VPPOC it acts as a floor, but when price is testing this level from below, it acts like a glass ceiling.
And while the Biotech ETF (IBB) has a market cap of only $8 billion, the market cap of its top 10 holdings, which represent 60% of total assets, is a staggering $632 billion. This means the Biotech Sector ETF is a proxy for a $1 trillion whale.
In comparison, the market-leading, headline-grabbing FANG group (Facebook, Amazon, Netflix and Google) has a market cap of $1.2 trillion.
When profit taking finally hits the strongest stocks or sectors in a bull market the resulting correction is usually very intense, as leveraged hedge funds all run for the exit at the same time. We have already seen a preview of that behavior in IBB during 2015, and the Volume Profile chart suggests that the risk of a sudden drop to $229 remains substantial as we begin the New Year.
www.daytradingpsychology.com (Peak performance coaching for private traders)
www.trader-analytics.com (Services for traders at RIAs, banks and hedge funds)