In determining the potential upside opportunity and downside risk in the stock indices, it is helpful to view them together and compare and contrast their relative positions.
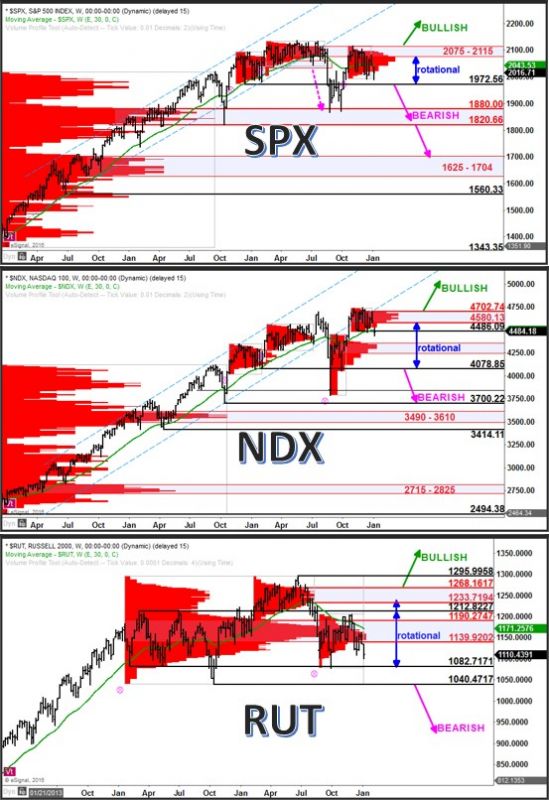
In the S&P 500 (SPX), resistance remains at 2075 – 2115. This is a zone that was established over the first half of 2015 and that the index spent a majority of the 4th quarter attempting to break above unsuccessfully. The sharp selloff to start out 2016 leaves this resistance zone intact and the index is now nearing lower support at 1972. Any breach of 1972 would be a bearish development and would target the major zone of support at 1820 – 1880. Considering that this big picture support zone has been tested (and held) twice already, typically a third test does not have favorable odds for holding.
The Nasdaq 100 (NDX) has established overhead resistance at 4580 – 4702 and is now biased toward rotational price action targeting support at 4250 – 4350 and possibly 4078 to the downside. Any breach of lower support at 4078 would be a substantial negative for this index and shift the big picture bias to bearish.
The Russell 2000 (RUT) is trading near the lower end of its rotational range, just above support at 1040 – 1084. This is a critical zone of support and any breach would shift the larger bias to bearish and target a potentially large decline.
On any stock market rally, you can see from the charts that the Nasdaq 100 is nearest to potentially re-establishing a bullish bias if it were to break above 4702. Next would be the S&P 500 if it were to break above 2115. Lastly, you can see that the Russell 2000 has the most work to do in order to shift into an outright bullish position, needing to move above 1268.
If you’d like to learn more about how to read the stock market using volume at price information, click here. http://www.volumeatprice.com