
Timing can be everything, especially in financial markets. Fortunately there are numerous types of timing tools that have been developed over the years that can be of great benefit to a trader. A wide range of techniques exist, from long used cyclical analysis to the esoteric “Delta” phenomena developed by Wells Wilder. As diverse as these methods seem, they all attempt to find time frames in which to expect some type of market reversal. There are many ways to use this valuable type of tool in a trader’s arsenal. Implementation of course varies depending on the strategy that one is using.
One method that can be consistently reliable is the use of Fibonacci time frames. Most traders are familiar with Fibonacci price projections and retracements. With these, given previous swings, one can use Fibonacci ratios to suggest probable price objectives. These can be very effective in entering or exiting market positions. However, not a lot of quality work has been published in regards to timing. That is interesting since it is easy to forget that chart analysis has two dimensions; price and time.
Not surprisingly price projections and timing windows are generated using the same principles.
Price fluctuation in a specific direction is equivalent to a single unbroken price change called a swing. As price rises, the bars on a chart will make higher highs and lows. At some point the move up will end and price will reverse lower. In its simplest form, a swing high represents a high bar surrounded by lower highs on either side. Just the opposite applies for a low. This classification of a swing is applicable to all bar charts in any time frame.
A Simple Swing High.
Bar charts have an innate hierarchy of swings, which define trends, corrections, and reversals. For example a swing high is more significant if it is higher than the previous and following swing highs.
By using a swing hierarchy and standard Fibonacci ratios (.381, .618, 1.618) price projections are created. In the same manner timing windows can be forecast as well. This is done by measuring the time period (i.e. number of bars) between significant swings. This time count is then multiplied by standard Fibonacci ratios, and added to the date of the most recent swing.
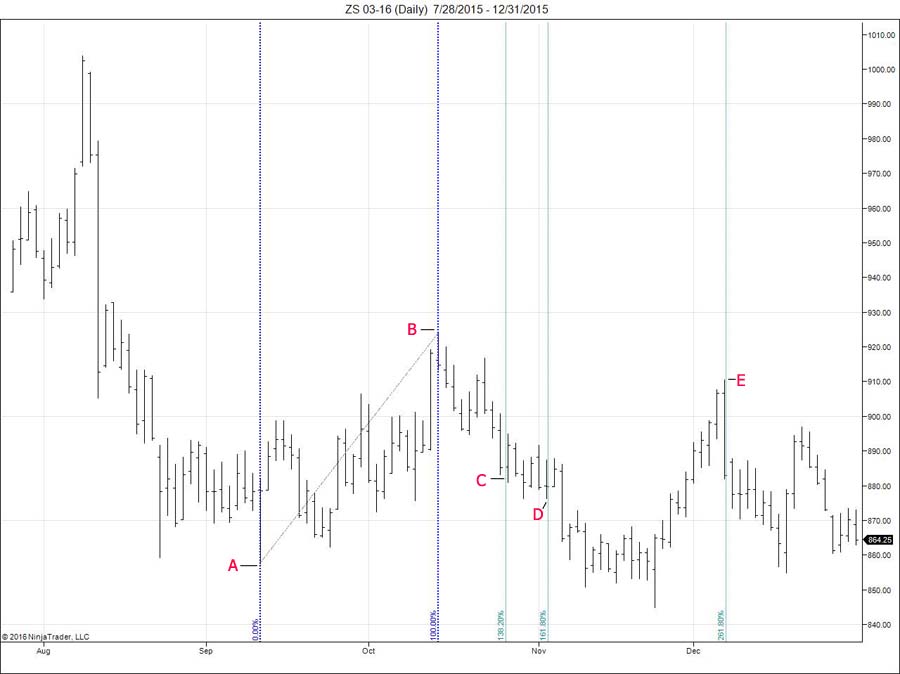
In the March 2016 soybean chart below, I’ve projected the ratios between the important swing low on 9/11 (A) , and the significant high on 10/14 (B). The 1.618 projection (E) was for a turn on 12/7 which turned out to be a very significant high. While the .381 and .618 projections appear to be insignificant, look again. The projection at 10/27 and 11/3 (C and D) respectively were both actually swing lows. This highlights an important point about Fibonacci timing windows; their influence is quite often there, however other market forces sometimes lower their significance.
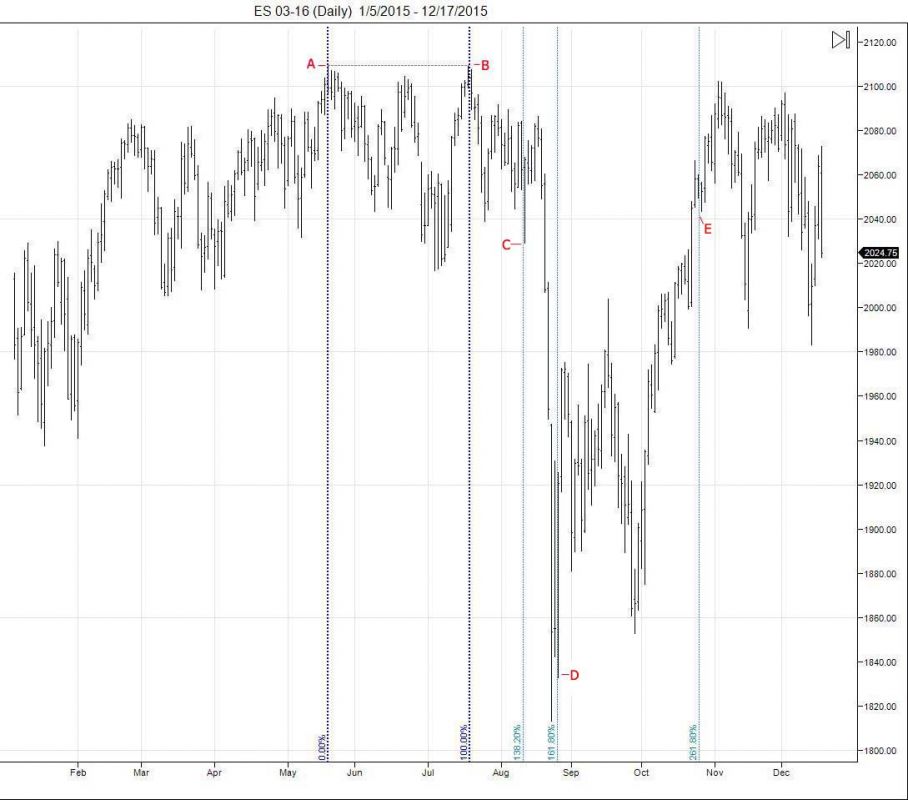
Projections can be made not only between high and low, but high to high and low to low. The March 2016 S&P chart below is a good example. Working off the highs on 5/19 (A) and 7/20 (B) the .318 projection correctly predicted the 8/12 low (C). The .618 projection was 8/26 (D). Even though it wasn’t as important a low as two days previously on 8/24, the swing low on the 26th was still very significant. Also of interest is the 1.618 projection of 10/26 (E). While it didn’t provide a significant reversal, it is bracketed by swings on both sides. Another good example that there was obviously some timing influence on price.
These two charts are good examples of Fibonacci timing windows in action. However, they are projected from just one data set. A much more accurate and effective method is to use multiple data sets and look for clusters of projections. This gives more significance to the timing window.
It’s easy to observe this phenomena, the question is how to use them in trading? They seem to be most valuable in taking profits and adding to positions. In the above example, if one were to be short into the 8/26 time frame (D), it would give a trader more reason in taking some or all profits. In the example at (E), if one were long going into the 10/26 timeframe, one might consider taking some profits on the rally, or if other indicators still suggest higher prices, one might consider adding to the position on a setback.
Fibonacci timing windows are a great way to manage a position. And while this method cannot be used by itself as an entry signal, it can be a very successful way to enhance entry effectiveness. It is certainly something a trader should consider in their strategy.
Learn more of Paul Kogut’s clear, actionable trading strategies in his highly rated book

