

In our earlier post about the Dollar Index, published last October, we described a likely upward path that might continue into 2017 and beyond. That view still informs our big-picture forecasts for precious metals, foreign exchange instruments, and commodities such as oil and copper. However in the near term, the Dollar appears to be retreating from the upper edge of a corrective envelope.
In the context of the chart in the earlier post, the consolidation that has persisted since early 2015 fits well as a fourth wave of a five-wave sequence up from the 2011. The details of that consolidation are more visible on a weekly chart, as shown below. By our count, the consolidation is not yet finished.
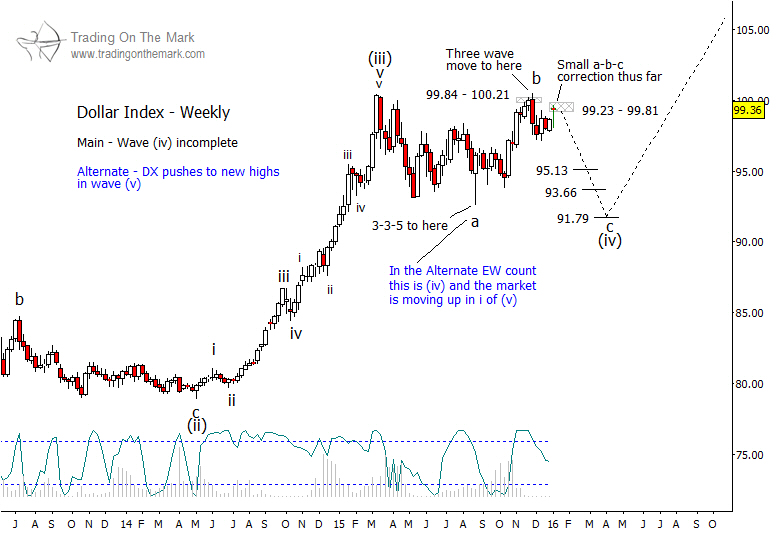
In our primary scenario, the present correction requires another downward leg, which would be sub-wave ‘c’ of wave (iv) on the weekly chart. Traders looking for swing trades in the Dollar Index or in paired currencies might watch for the index to decline from the resistance area drawn around 99.23 to 99.81, and they might also place stops consistent with the idea that the index should not exceed that area by much.
If the index follows our primary path, then supports around 95.13, 93.66, and 91.79 might act as stepping stones on the way down. In addition, it is important to recognize that price may not visit all of those levels. As a timing aid, chart cycles suggest that the index might try to set a low around March or April.
Usually, we have at least one alternate scenario for our Elliott Wave projections. With the Dollar Index, it is possible that the entirety of corrective wave (iv) ended at the low of August 2015. If that is the case, then the index should move above the resistance area within the next several weeks, if not right away.
The January edition of our newsletter will examine the implications of a rising Dollar for commodities, metals, and other issues. Be sure to request a copy!

