All through the fall we’ve been hearing that the US equity markets have “disconnected” from the chaos developing in the rest of the world. The US was “the cleanest dirty shirt.” China only accounted for 7% of the world economy; how could it possibly damage the US behemoth?
The past week has demonstrated the fly in that ointment. The large cap index of US stocks, the S&P500, had the worst opening week ever, down about 140 point since the start of the year – only one positive day in the last six, and that was a measly four-point gain.
The cause of the bloodshed is the emerging markets, and specifically China. They make their money from commodities, and commodities have gone in the dumpster: oil traded below $30 a barrel briefly this week, and copper is under $2 a pound.
The effect on emerging markets is obvious. And those effects are now showing up in the US.
Before Thursday’s open the Shanghai composite index dropped 7% in just 29 minutes of trading… before they shut the exchange down.
The S&P mini-futures (ESH6), which trade overnight while US markets are closed, dropped 40 points in overnight trading, opened Thursday with a huge gap down, struggled up 20 points, dropped down 40 points, and closed with a loss of about 53 points on the day. That’s contagion in action.
It not clear if this is the start of the Big Dump, and we’re half expecting a little oversold bounce in the US index today (see below). What is clear is that there’s no such thing as a safe haven anymore; when a big market stumbles everybody suffers. The hip bone’s still connected to the knee bone.
Today
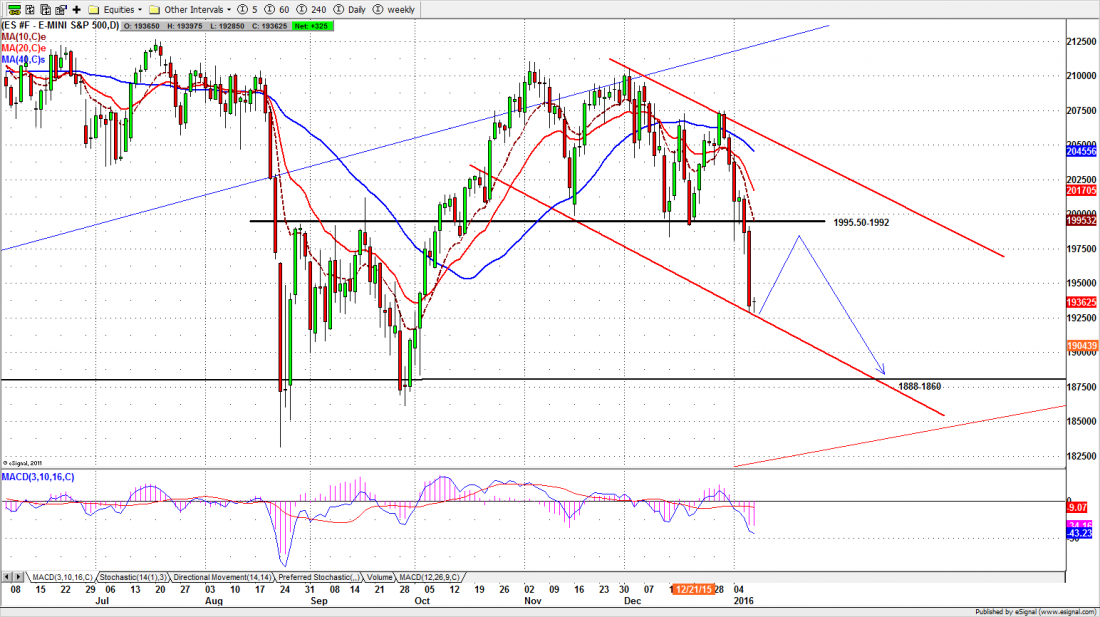
It now looks more and more likely that the long-term top in US equity indices has been posted. The S&P500 mini-futures (ES) have broken the horizontal support at 1995-92 and this zone now becomes a solid resistance. All the daily momentum lines (10/20/40ema lines) chased the price down and created strong selling pressure Thursday.
There is a double top pattern in the ES with the neckline around the 1992-91 area; that gives a maximum target for the breakdown near the 1888-77 zone. But probably not this week.
When we look at the daily range breakout measurement from the support level at 1970.25 (broken on Monday), the maximum target should be near 1927.50.
We got within one point of that price Thursday, and that suggests the momentum range breakout shorts will start covering soon.
The short-term indicators are becoming extremely oversold, and next week is the January option expiration. Don’t be surprised if we have some profit taking in the early sessions Friday, and an oversold bounce. Unless Shanghai drops dead again.
Major support levels: 1926.50-25.50, 1908-06.50, 1888-86.50, 1866-62.50
Major resistance levels: 1956.50-57.50, 1970-65.50, 2005-98.50, 2014.50-17
Naturus.com is having its once-a-year half price sale this week and next. 50% off everything. You can see the details here: http://wp.me/P69TkB-W2
Chart: S&P500 mini-futures Dec. 7, 2016