

My December 14 commentary included a forecast for a high in equities near December 24. The eventual high which led to last week’s big sell-off came two trading days late on December 29. In this week’s commentary we turn our attention to forecasting a bottom to the current decline in equities.
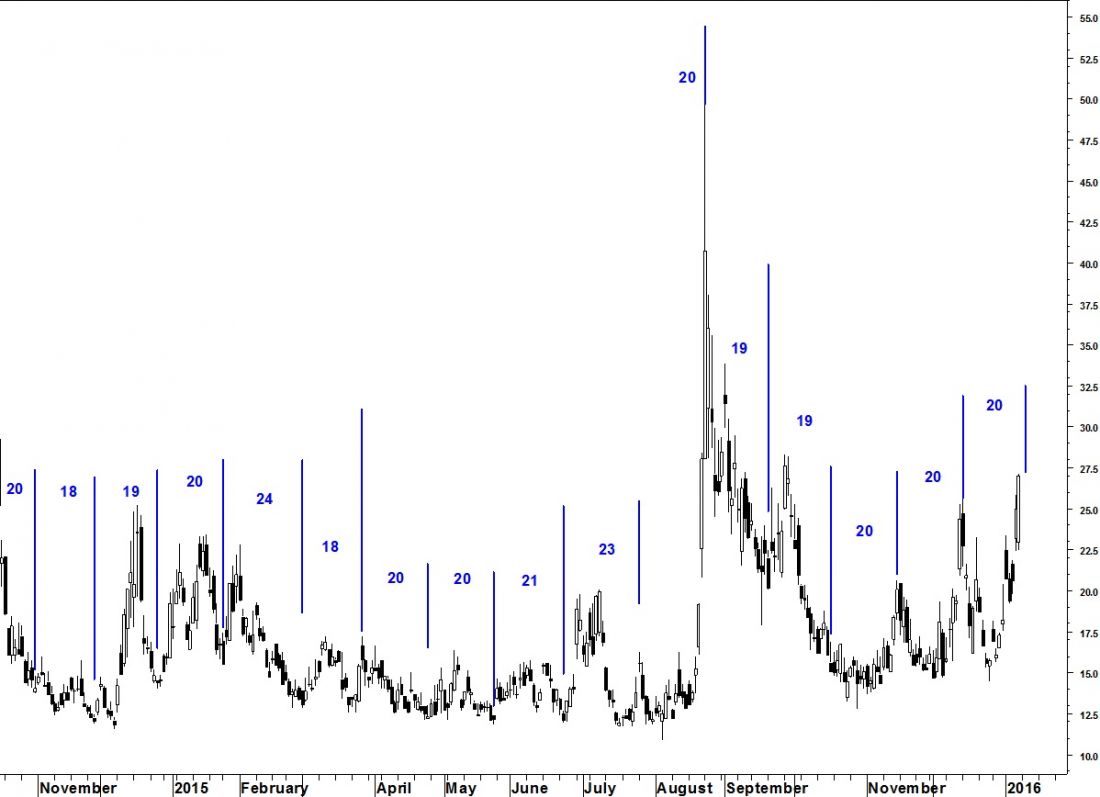
By combining the concept of Middle Sections (developed by the late technician George Lindsay) with my own, more traditional approach to cycles, I have developed a forecasting model I call the Hybrid Lindsay Model. It is used to forecast the calendar dates of highs and lows in the Dow Jones industrial index. It does not forecast price levels. The forecast for a low in the Dow this week is detailed below. While not part of the model, a happy coincidence is that the CBOE Volatility Index (VIX) has 20 trading-day cycle high due on January 12 (chart) giving that day (Tuesday) the highest probability for an end to the decline.
Middle Sections
A flattened top on 8/18/06 counts 1,719days to the high of the previous Basic Cycle on 5/22/11. 1,719 days later is January 15.
Point C of a descending Middle Section on 9/25/14 counts 236 days to the high of the Multiple Cycle on 5/19/15. 237 days later is Monday, January 12.
Cycles
A micro-cycle low is due on 1/12/16. A monthly trading cycle low is due near 1/15/16. There are two other equally reliable trading cycles due Jan 22-25. We need to keep those in mind.
Don’t forget the 34-week cycle which has done a phenomenal job marking highs during the bull market. It is due the week of Jan 18-22. I expect it will make an early showing this time.
Lindsay Intervals
107-day interval (102-112 days) counted from the low on 9/29/15 counts to a high in the period January 11-19.
A low-high-high count will exist if a top falls on 1/13/16 (which is 71 days after the high of Nov 3, which is 71 days after the low 8/24/15).
Try a one-month “sneak-peek” (trial subscription) at Seattle Technical Advisors.com

