

The stock market is off to a horrible start this year with the S&P 500 off more than 6%, already. There’s been little argument that the prolonged sideways period has created what’s typically referred to as a, “trader’s environment.” This is simply the active management of positions as opposed to buy and hold/pray. This week, we’re going to make three key points that have to do with apples to apples data calculations in the Commitment of Traders (COT) reports along with the short and long-term effects we believe the commercial traders’ collective actions are forecasting.
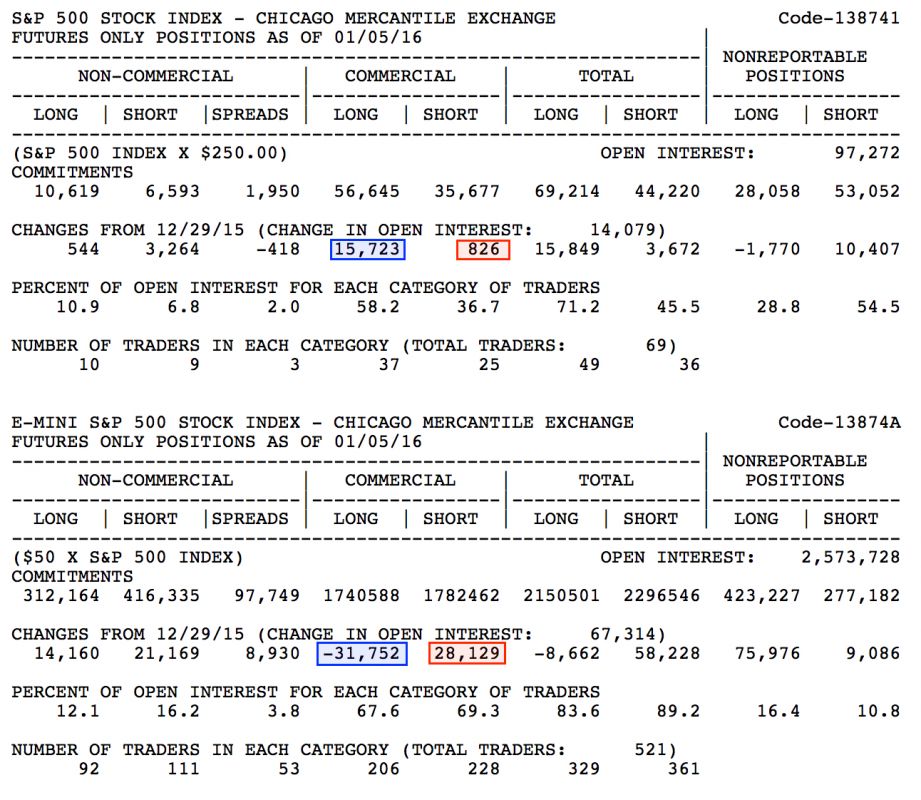
First the data issue. We track the net commercial trader position of all the domestic liquid futures contracts and use this metric to dictate bias within the markets. We track both the raw numbers as well as the momentum of their recent purchases or sales. We feel these two key elements help determine the peaks and valleys as well as the major trends. To that point, the Commodity Futures Trading Commission (CFTC) reports the full size S&P 500 and the mini-S&P 500 separately in the COT report. You’ll notice the commercial traders’ weekly actions in the four highlighted boxes below. Doing the math shows that commercial traders added 15,723 full size S&P 500 contracts to their net position while selling 31,752 mini S&P 500 contracts. The full size S&P is 5X the mini S&P’s size. Therefore, the commercial traders added 15,723 + (-31,752/5) = 9,373 total long positions over the last week. Now, commercial traders also added 826 full size short positions as well as 28,129 mini S&P short positions which equals a total of 6,452 commercial short positions added. This gives us a grand total of 2,921 full size S&P 500 contracts added to the commercial net trader position for last week. Most data programs don’t sort that out manually. Make sure you know what products you’re tracking in your analysis and that you have all of the necessary data to arrive at the proper metric.
What’s it mean to the market? Well, their buying has shifted commercial trader momentum back to the buy side. Given the depth of the decline and the recent commercial buying interest, it looks like there should be a short-term rally. Commercial traders like buying market dips that have been deep enough to flush the weak buy and holds. In this case, the overly anxious January Effect guys. We see this time and time again. Currently, the S&P is sitting at its 120 week moving average at 1911.50. Furthermore, in spite of the market’s decline, most of the major averages have still retained their positive slope. We expect to find a bottom shortly and ride it back up to positive territory. However, and here’s where we switch gears, commercial traders are sitting near the high side of their net position. I believe over the March contract’s life, we’ll see commercial trader momentum shift to the sell side and lock in the tone for a lousy late spring/summer. Obviously, we’ll keep an eye on this, “trader’s environment” and update accordingly.
See our full COT research at Cot Signals.

