My message on the VIX and the position of the SPX has remained the same for quite some time. Just as I first published here on TraderPlanet in my November 25th, 2015 article ‘Drawing Parallels to Pre-Financial Crisis’, it’s like Deja-vu all over again.
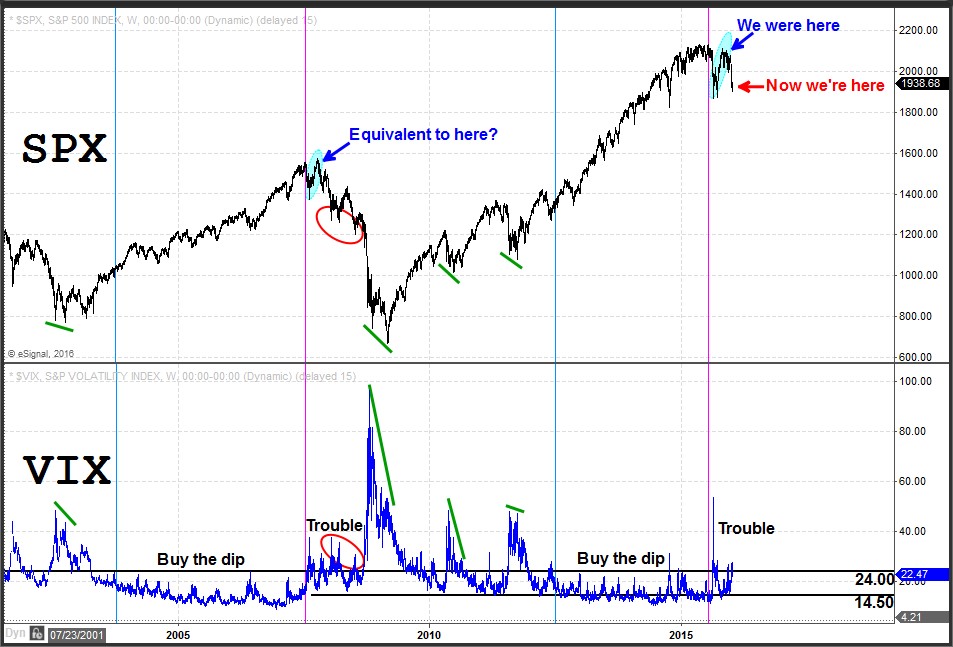
The period prior to the downturn in 2007 is the comparison I am measuring the current price action against. I’ve indicated the areas of comparison on the chart with blue highlights where I’ve marked ‘We were here’ and ‘Equivalent to here?’.
The August 2015 spike in VIX, which came after a prolonged period of low VIX readings (sustained below 24), is similar to what we saw in late 2007 following the prior years of sustained low VIX readings. The ‘buy the dip’ environment ended after that initial spike in VIX but the S&P did not head lower right away. It was only after a recovery rally that the index rolled over and began declining in earnest. So far we have seen a replay of the price action and VIX action from 2007.
The SPX has now breached nearby supports and has shifted to a bearish bias accompanied by the VIX rising above the 25 level. This is suggestive of further trouble ahead regardless of whether or not it is more or less severe than in 2007/2008.
If you’d like to learn more about how to read the stock market using volume at price information, click here. http://www.volumeatprice.com