

With the markets going a tad wild and volatile, earnings season is going to be a doozy.
Individual equities should be very interesting. Let’s talk about FB. Here are 7 Facts regarding the charts.
#1 FB bounced off of the 200 simple moving average on the daily chart.
#2 The low of FB on 1/14/16 was 92.45. The 200 SMA is 92.50
#3 On 11/05/15 FB formed nearly a perfect doji at an all-time high. (I personally see this as a possible all time high break out failure.)
#4 The 100 simple moving average on the weekly chart is at 80.45 (This proved to be some support from the late August 2014 flash crash)
#5 The 50 exponential moving average on a weekly chart is at 91.62
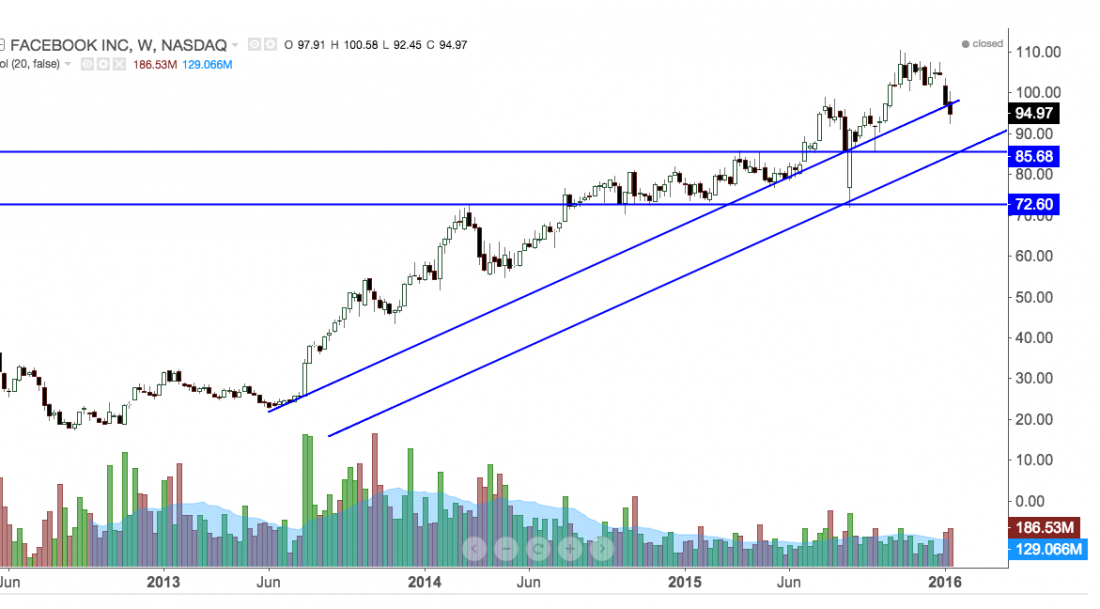
#6 There is an old support price at 85.68 on FB. This was a previous old time high area and a very strong pivot area.
#7 On a weekly level, FB has been making higher highs and higher lows.
What’s the verdict? FB is still bullish long term. I would remain bullish on a primary trend level unless FB breaks 85.68. At that point, I would switch to neutral on FB. If FB broke 72.60, I would be bearish.
Therefore, I’m still looking to buy dips and be patient on FB. It’s a very ‘grindy’ stock. FB takes its sweet time to move higher. Earnings will be a delight. I am slightly looking to buy off of the 100 SMA on the weekly chart. This recent bearish volume increase makes me think FB really could pull back lower than it is right now.
Hop over to my professional trading page and check out how traders have the capability to receive up to $250,000 of allocated funds to day trade stocks with! I explain the pros and cons, but most importantly I focus on how to mitigate risk regardless of your trading style!

