The Dow Jones Industrial Average provides a shining example of what is possible using volume-at-price analysis.
In the TraderPlanet article, Key Levels In the Dow You Need to Watch Now, published on September 9, 2015, I laid out in simple terms the results of my volume-at-price analysis in the Dow.
There’s no ambiguity in my opinion on this matter. The stock indices are bouncing to another opportune selling area and will continue with a new downside push once we’ve reached these zones.
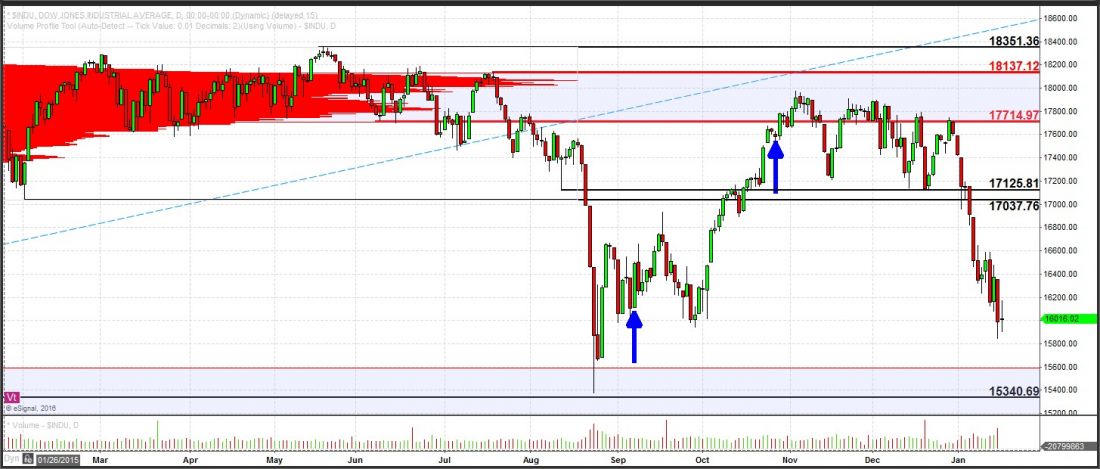
If by chance the Dow could manage to push above [17,125], the robust area of resistance beginning at 17,714 is a prime selling opportunity, if only the index manages to reach it.
I originally made these comments more than 4 months ago, stating in no uncertain terms my expectation, which has now come to pass. I called attention to this original analysis again at the end of October when the Dow was approaching the ‘prime selling opportunity’ (see Here We DOW Again, October 28, 2015).
The dates these articles were published on TraderPlanet are marked on the chart below with the blue arrows. With hindsight now 20/20, you can see the Dow responded exactly as expected.
This is the type of advantage and consistency that traders using volume-at-price information regularly enjoy that is not easily found using any other method of market analysis.
If you’d like to learn more about how to read the stock market using volume at price information, click here. http://www.volumeatprice.com