2016 been a terrible year so far. But our analysis of the technical indicators says it is going to get worse. Maybe much worse.
The large-cap index, the S&P500 (SPX) traded below last year’s low in intraday trading on Friday and again yesterday (Tuesday). Both times the market managed to recover enough to close above 1859-60, which is the critical support area. (The SPX closed at 1881.33 Tuesday).
But this is getting too close for comfort. The next major support we have identified for the SPX is around 1770, which would be a decline of about 17% from the 2015 top (just below 2135).
That is a long way from a market crash, but it would be a big enough hit to change the entire investment outlook… and not for the better.
Nothing drops straight down in the market, and there may well be a bounce, perhaps even this week. The market is oversold, the Bulls may enter to protect that1859-60 support level, and the victorious shorts will be pulling some of their profits out and shopping for Bentleys.
There may be something heroic in the earnings reports coming out this week and next that the Bulls can turn into a tale of resurrection. Maybe the Fed will try to talk the market up at their January meeting next week. The dying Bull market may even have a blow-off top hiding somewhere.
But despite all that, and despite the best efforts of the vast machinery devoted to getting people to buy stocks, we don’t think that support can hold. And when it goes, the only intermediate-term stopping point we can see is 1770.
If the SPX closes firmly below the current support – say 1850 on a weekly basis – watch for that level. You’ll see it in your 401K statements.
We aren’t anywhere near the bottom.
Today
Fortunately we don’t have to worry about that. We are traders, not investors, and the first two weeks of the year have been wonderful for us. (If you want to see a discussion of why volatility could be your best friend, you can read this article)
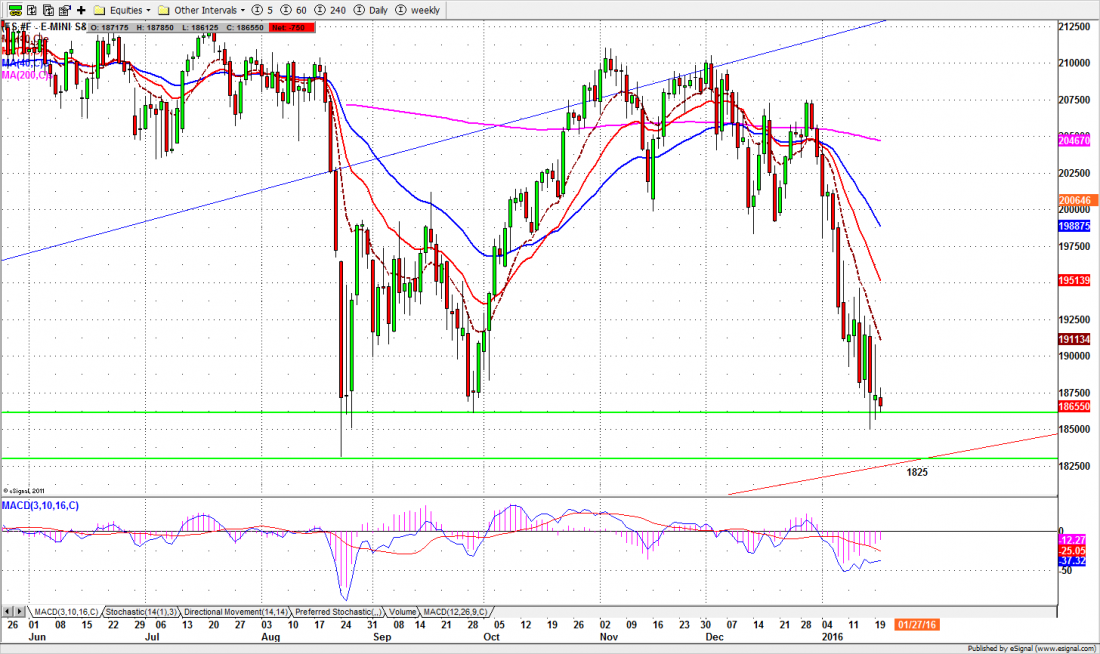
For today, the daily chart is showing the S&P500 mini-futures (ES) with a short-term oversold condition which may lead to a little bounce or more likely a few days of sideways movement until it is resolved,
1985.50 remains a key line for trading. A move above it could lead ES back up to yesterday’s high area 1903.50-07.50 or slightly higher to the 1916.50-14.50 zone to run some stops.
Holding below 1985.50-87.50 could give traders the impression the ES still has some room on the downside. Aggressive sellers may push the price back down to yesterday’s low area again.
A break below 1849.50 will be bearish. A further decline toward 1831-33 should then be expected.
Earning season moves into full gear this week. The Street whispers that earnings are disappointing and the market may get whipped around as a result.
Major support levels: 1830-1825, 1816-1818, 1800-1795
Major resistance levels: 1929.50-32.50, 1956.50-57.50, 1970-65.50
Once a year Naturus.com has a New Years sale. It’s on now. You can get anything we offer for half the usual price. Details at Naturus.com
Chart: ESH6 Daily chart, Jan. 19, 2016