The S&P 500, the large-cap index of US stocks, has had a terrible year so far, down about 10% since the start of 2016. So when it bounced, just a little, last Thursday and Friday, you could almost hear Wall Street inhaling hope like a junkie hitting a crack pipe.
Hope, as they say, springs eternal in the human breast, even those that inhabit the counting houses of Manhattan, now buried in snow. But it is a painfully slender reed they are grasping. And they know it.
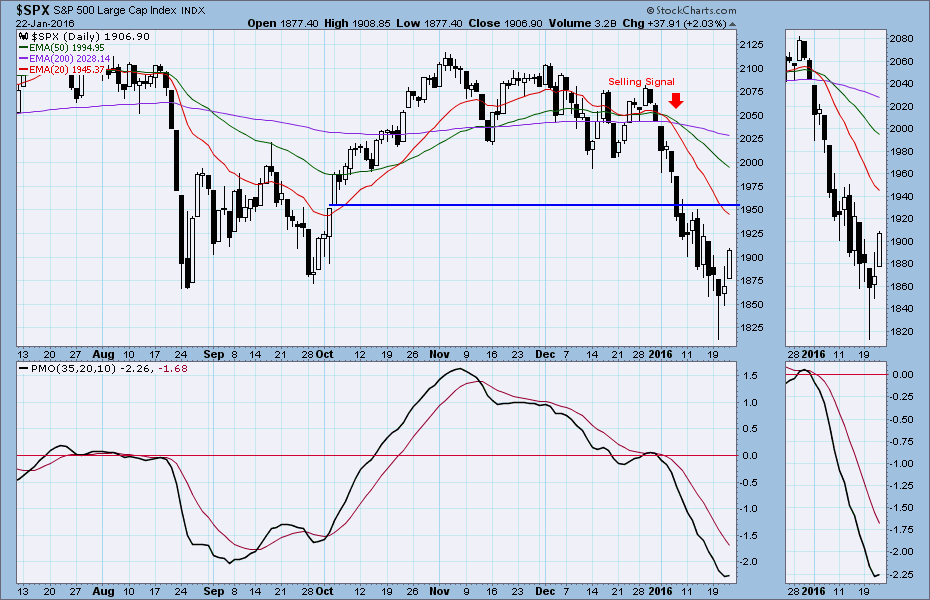
The S&P 500 cash index (SPX) closed at 1906.90 last Friday, up 26.57 points for a net weekly gain of 1.4%. For the week it made a lower high and bounced sharply from a lower low, a common consolidation move after a waterfall decline.
We do not yet have confirmation that a bear market is under way, a fact that is comforting and useful to the people who want you to give them your money in exchange for their promise that everything is alright now. See, it was only a correction. That’s all.
That’s a lot of mileage to get from two days that didn’t go down, following 14 that did. And you’ll hear more of it if the SPX manages to hold above the 200-day moving average line to close out the month on Friday, as it well may.
But here are the numbers you want to watch before you decide it’s safe to go back in the water.
1900. That’s a psychologically-important sentiment area. There will be a strong attempt to make sure the January close is above it. If we close below that level, keep your money in your pocket.
1960-1965. The market is heavily oversold in the short term, and we are likely to see a bounce, perhaps even a pretty decent rally. If it fails to move above 1960-65, that’s all it is, a bounce in an oversold market. Stay clear.
1800-1770. The market has formed a temporary support area around the October 2014 low and the 2015 low, roughly 1820 to 1865. It was the bounce from that support that set hearts aflutter last week. At some point it will return to that zone. When it does, watch for the underlying support, in the region of 1800-1770. That’s the tripwire. If the price falls below that major support, the bearish double top we are watching is confirmed, the Bear is awake, and the price will fall further.
But not this week. This week the most likely outcome is scrubbing back and forth into the end of the month. A little consolidation and a little breathing space until the struggle begins again.
Today
The bounce last week — really just a failure to continue crashing — was mainly due to two factors: the European Central Bank decided not to raise interest rates but instead hinted at more quantitative easing; and the market got badly oversold. The victorious shorts wanted to take some money off the table.
The mini-futures, (ESH6) the security we trade intra-day, gapped up on Friday and managed to hold most of the gain into the close. The action was bullish but the volume was down 29%, which is not encouraging.
Nonetheless there could be a short-squeeze Monday or Tuesday if the price moves above 1910. We can imagine a pop up to 1922-24. If it goes any higher, to 1936-43, we’ll be shorting it.
On the downside, the significant near-term support is around 1878. If it fails to hold the e-minis could drop to 1872-68.50 for the first target, or lower to 1855-57 to fill 1855 gap. If you see that gap filled, starting looking for a bounce back up.
Major support levels: 1850-45, 1830-25
Major resistance levels: 1950-56, 1975-78, 1993.75-96.50
You can get detailed analyses of gold futures, the ES e-mini futures and index options from Naturus.com for as little as $9 a month. Or join the mailing list and get summaries for free. Here’s the link: http://www.naturus.com
Daily Chart: S&P500 cash index (SPX) to Jan. 22, 2016