

Do you trade the news? Some technical traders ignore the news, but understanding when it gets one-sided can offer extraordinary trading, especially for those who know how to read the markets.
A One-Sided Market
Early last Wednesday morning, January 20th, news outlets like CNN were talking gloom and doom before the US markets opened. The European and Asian markets were selling down hard, they said. The markets were in dire shape. They even had a name for the coming trading day: “Red Wednesday,” as if the market would see no bottom.
Other news websites that morning were all very negative on the market. One announced, “The Party’s Over.” Another declared, “The Stock Market is Plunging.” A popular site said, “Welcome to Red Wednesday: Is it 2008 all over again?” You couldn’t get much more negative than that.
Trend Change?
When the public (as reflected by the news) becomes one-sided, it’s often time for a trend change. Although everyone was predicting more selling with no end in sight on “Red Wednesday,” those traders who understand the markets and know how to read them saw the trend change. They were the Savvy traders who were able to see the outstanding trading opportunities when the news became so biased.
Let’s see how this played out in the S&P e-mini futures (ES) on that day.
The Bottom
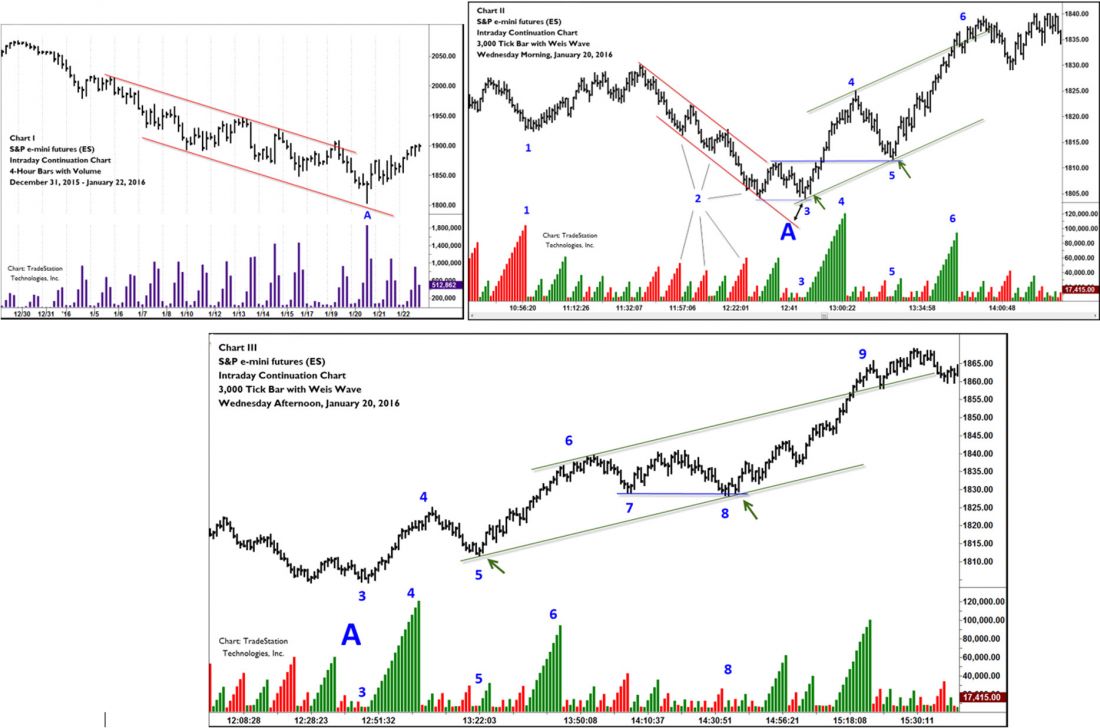
Chart I is a 4-hour chart of the S&Ps. It shows the multiday down trend, framed by the simple but highly effective downtrend channel. Although A had not yet occurred, the trend channel gave us advance warning that the market had entered oversold territory.
Chart II is an intraday chart of Wednesday morning with swing volume. Swing volume measures the volume of the market swings or, waves, and is especially useful for intraday trading as the standard volume histogram can be confusing to read. The large “A” is the oversold area from the 4-hour chart. There are a few things to note here.
Supply Dries Up
First, the decline highlighted by 2 did not produce the same level of heavy volume on the down swings as the earlier swing marked 1. Supply, or selling, was easing. At 3, it became obvious that supply had become exhausted. The very low volume indicated lack of selling. Price stopped well above the bottom of the trend channel, indicating sellers were unable to push price down. There was also obvious buying in the price bars. All this occurred in the oversold area of the higher time frame—a good location with ample indications for an aggressive buy.
Demand Shows Up
Demand or buying came in assertively on the swing up to 4. Note the strong volume. Buyers were gaining control. The pullback to prior resistance at 5 drew no supply. Given the demand and lack of supply, the character of the market had changed. This was a strong buy signal. It produced a 20+ point trade until the market reached the overbought area (again, by a simple trend channel) at 6.
Another Great Trade
Later that afternoon, Chart I had completed the strong bar at A with its heavy volume. This reflects climactic action signaling the market has now turned up. Chart III shows the early afternoon market holding its morning gains. A classic Wyckoff Spring trade sets up at 8 when price was unable to follow through lower, after dipping underneath the lows formed at 7. This produced another 20+ point trade to the top of the trend channel.
Understanding the news can be a profitable arrow in the trader’s quiver. It requires knowing when news becomes one-sided, as well as skill at reading price and volume to detect changes in market character. If you would like to learn more about reading the market in this way, the author has a free video showing how markets can be traded bar-by-bar and swing by swing covering several principles you can immediately use in your trading. Simply click here for the author’s free library of useful trading material.

