

On Friday morning I pointed out “a curiously bullish configuration in the Nasdaq futures.” I added, however, that “the real market leadership at this time is coming from the Dow.”
Friday was indeed a good day for the Dow, up almost 400 points. After strong up days, the market usually consolidates its gains. Most traders are quite skeptical of this market and don’t expect much of a rally. Based on an analysis of the volume pattern, I think the skeptics will be disappointed.
The accompanying Volume Profile chart has a lookback period of 500 days. Over that time the largest volume occurred at a price of 2071, which is called the Volume Profile Point of Control and it currently represents a level of significant long-term resistance.
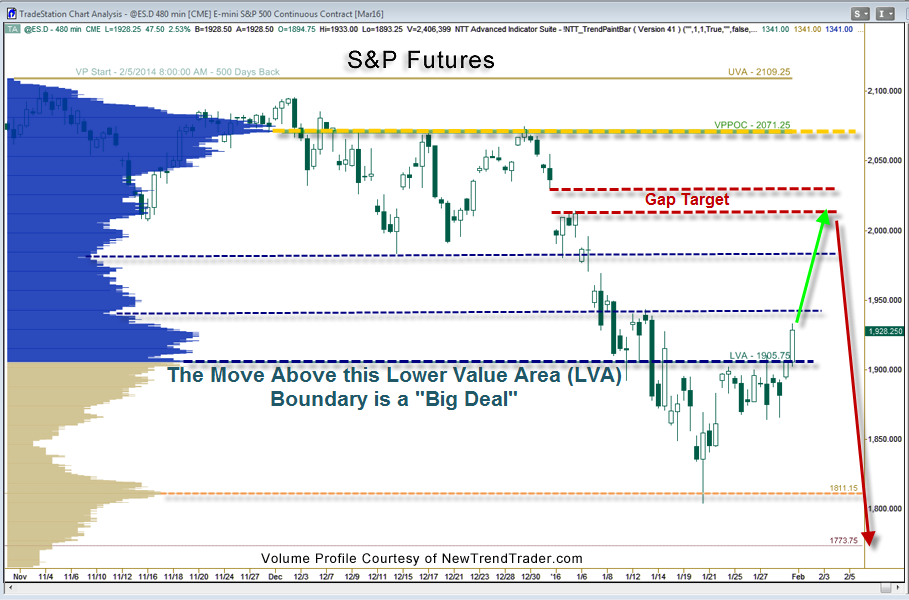
I’m not expecting the S&P to get all the way up there, but there is an unfilled gap below that level (2014-2030) that begs to be filled. Friday’s pop above the LVA (1905) is a technically bullish development that puts the red gap zone in play. Filling gaps in both directions is a type of market housekeeping that almost always gets done eventually.
What’s important for the bulls in the short-term is that the S&P 500 not drop below the LVA level of 1905 until the gap is filled. The chart also shows some other nearby targets in blue.
www.daytradingpsychology.com (Coaching for private traders.)
www.trader-analytics.com (Peak performance consulting to RIAs, hedge funds and banks.)

