

Bloomberg says oil ($CL_F) will go as low as $10.00 a barrel whereas oil tycoon T. Boone Pickens says we could be headed for higher oil prices; no matter how you slice it, both of these sources could be right. The market is going to do what the market is going to do, but there are solid reasons for oil prices to rise and fall, the past 3 decades has shown us this without a doubt. There’s been a lot of talk from news sources and in the media that oil may be headed for $10.00 a barrel but some experts feel that oil may be headed for a rally that for many in the oil business feel is long overdue.
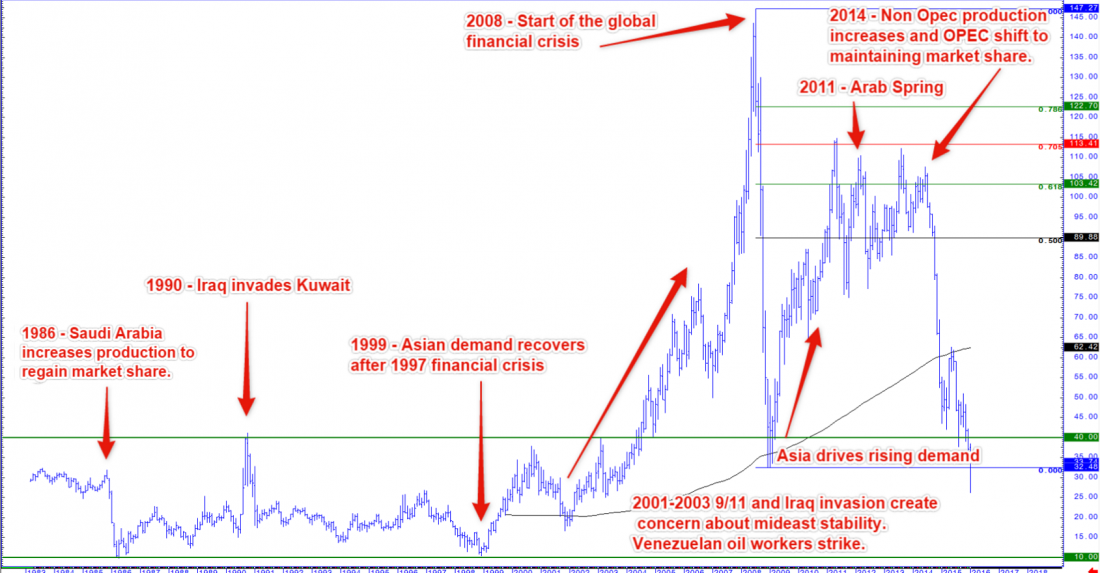
If you’re looking at the chart below, it gives MANY reasons why oil prices rose in the first place; what many new crude oil Traders fail to realize is that from the late seventies all the way through the mid 2000’s the CL traded between $10.00 and $40.00 a barrel. This range maintained itself for roughly 27 years! If you look at the chart, you’ll see 3 key events that were influential on the price of oil. Of course the Saudis raising production will have a massive effect to the downside, but wars such as Iraq invading Kuwait will drive prices up. Perhaps the greatest influence driving the increase in the price of oil was when China recovered from a financial crisis and the massive growth in the Chinese economy. This massive growth caused sharp price increases with the CL and that run to record highs stayed consistent until the global financial disaster, known as the “Great Recession” that occurred 2008.
After the massive free fall of the($CL_F) in 2008 the Chinese economy again took center stage and drove the rally with a greater demand for oil. Also, uncertainty in the Middle East (Arab Spring) began to affect those prices as well. So here we are again, right now the ($CL_F) is right at $33.15 a barrel, will it rally or will it continue to fall?
Although there is always a possibility of the CL shooting to the upside, my chart here is telling me something different. For starters, after oil plummeted in 2008 and prices began to rise once again due to overseas demand, price failed to break $115.00 per barrel THREE times! Another dead give-away for us here at the Oil Trading Group (OTG) is the fact that we have been trading UNDER the 200 SMA for the past 15 months (a record amount of time for oil to be trading under the 200 SMA). So, the real question is this; With the exception of a 10-year window in the mid 2000’s, Oil has hovered in a range between $10.00 and $40.00 per barrel. Is this a dramatic sell off or is this oil just moving back into the “value area” where it has spent the better part of 3 decades prior to 2004? Only time will tell but it is definitely worth the discussion.
Here at OTG we may have our opinions and thoughts on the big picture, and yes we have our eye on it, but we choose to focus on the opportunities and price action that the intraday trading market has to offer. The intraday moves that present themselves on the CL every day offer great trading opportunities and rather than trying to call the overall outcome of the CL itself, we capitalize on the moves that are offered on a day to day basis. Don’t get me wrong, we use that big-picture info, but we use it to trade on an intraday basis.
To receive a free trial from the Oil Trading Group, Click Here

