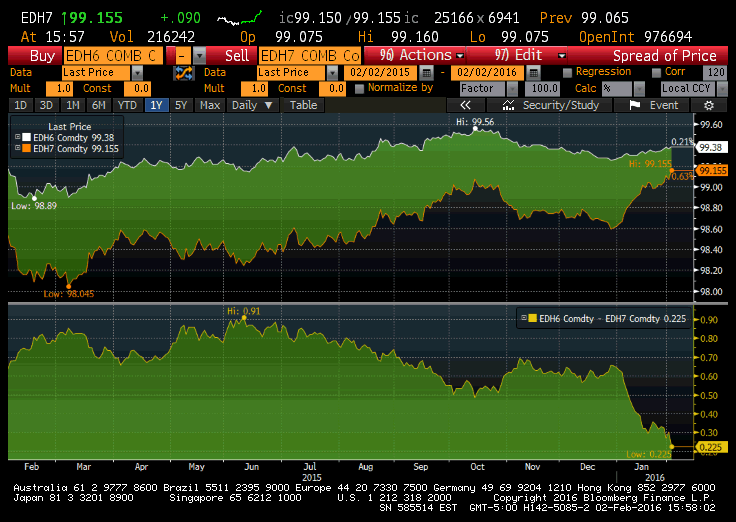
The chart below tells you just about all you need to know about the market’s assessment of how many rate hikes are going to come in the year of 2016. The chart is the one-year Eurodollar spread EDH’16 to EDH’17. The one-year spread is essentially a reflection of how much higher a forward rate will be as compared to now. As you can see the spread has collapsed from 91 bps to just 23.5 bps as of yesterday’s settlement. So the market’s assessment has dropped from more than 3 hikes as of mid-2015 (of 25 bps each) to more like 1. The renewed plunge in oil prices is a big factor, as is the fall in the stock market since the beginning of the year. So when Fed officials like the KC Fed head Esther George says the Fed should (and will) keep raising rates, as she did Tuesday, you may safely ignore them. Because the market is telling a different story.

The market has become quite tired of the Fed’s narrative that factors holding down inflation are transitory. A kid could finish a four year college program in that same transitory period. One of the Fed’s goals with QE was to boost stock prices and create consumer activity through the wealth effect. The stock market slide since the start of the year is more than just a little troublesome.
Alex Manzara: www.chartpoint.com


