

With the Dow Jones Industrial Average showing signs of breakdown, our primary chart scenario suggests that traders should look for downward-trending moves throughout most of 2016. However, we also expect the market to present several opportunities for traders to make missteps. This post offers a big-picture roadmap and identifies some likely targets for the first part of the expected decline.
In the larger view, we have been tracking an expanding “megaphone” pattern that appears to have begun its fifth and final leg downward from its high in early 2015. On a monthly chart (not shown), we believe price will reach close to the vicinity of a trend line that connects the index’s 2002 low and its 2009 low. However that test, if it is to occur, should be two or more years in the future. Meanwhile, we are trading based on the Elliott wave pattern we would expect to occur inside such a large move. The weekly chart below shows our projection for the first segment.
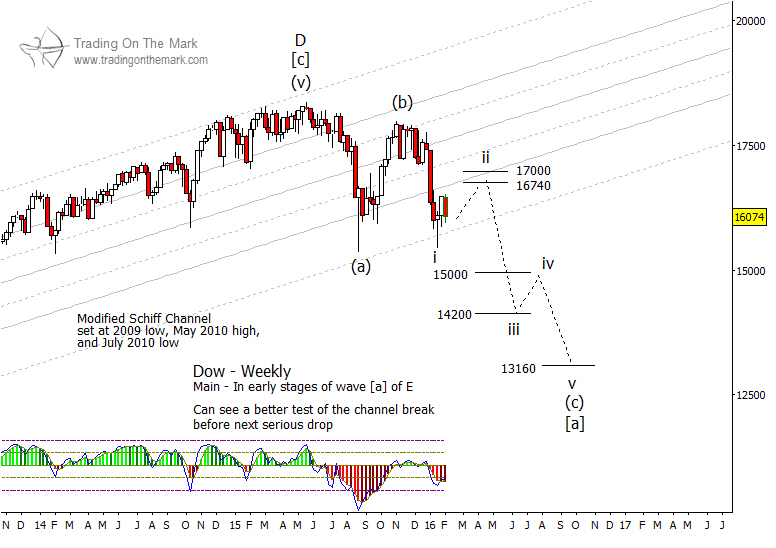
Counting down from the 2015 high, the index should present a three-wave (a)-(b)-(c) structure to complete the first part of the larger decline. Based on inspection of the pattern on weekly and daily charts, it appears that waves (a) and (b) are complete. Now price is probably moving in downward in wave (c), which should consist of five sub-waves.
There is a risk that traders may respond to the January 2015 decline by becoming too eager to enter new short positions. In our view, price action during February and March is likely to be choppy, with numerous “fake outs.” While it makes sense to look for an upward wave ‘ii’ correction in order to find entries, it is important to give the pattern enough time to test the broken channel and standard retracement targets from below. Thus, we would look for sub-wave ‘iii’ of (c) to begin from higher – perhaps near 16,740 or 17,000 on the index.
The weekly chart also presents initial targets for downward wave ‘iii’ at 15,000 and 14,200, and we have drawn a speculative target for wave ‘v’ of (c) – the completion of the entire first part of a larger decline — at 13,160. However, we may refine those targets as the pattern develops.
Our next newsletter will feature charts for additional stock indices and will also cover bonds and interest rates. Just ask to receive your copy!

