The S&P 500 cash index ($SPX) closed at 1880.05 last Friday, down 26.85 points for net weekly loss of 1.40%.
Friday was especially brutal, one big red candle than carried the price right back down to the recent support around 1875, extinguishing all the gains made a week earlier, and reminding traders that there is a very big and very empty void below the current price.
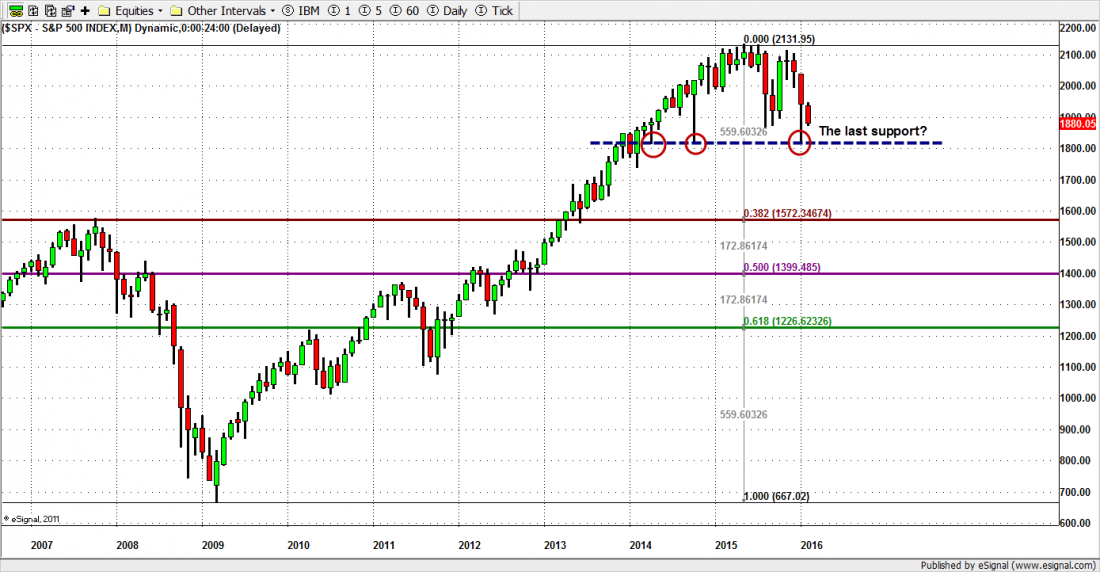
The number to watch is 1812 – think about the last time the US was invaded by foreign troops – which is approximately the level where the last support sits for the SPX.
That level was touched January 20, the first time that price had been seen since October 2014. Below that level the chart does not show any obvious place to stop until it reaches roughly 1575, the double top formed in 2007, by which time six years of profits will be extinguished.
And that would not be a grotesquely huge crash; it represents almost exactly a 38% Fibonacci retracement of the current Bull Run.
Clearly the long-term bullish outlook is deteriorating. The recent bounce wasn’t strong enough to carry the price back up to last September’s high, to the despair of the buyers, and we are currently in a no-man’s land between the recent support around 1875 and the recent high around 1940.
This may be the week the S&P500 index confirms that the Bear market has started. A weekly close below 1800 will convince long-term traders that what may be the last support is broken.
As long as the index can’t close above the 1950 level the price should gradually move lower. We expect the 1585-75 zone to be tested sooner or later.
In the last War of 1812 the British burned the White House. This time won’t be that bad. But it won’t be pretty.
This week
The Federal Reserve is in full cry this week, with speeches by Janet Yellen Wednesday and Thursday and Robert Kaplan, president of the Dallas Fed, on Friday. No matter what they say – likely a coded message there are no rate hikes in view – the market will be agitated.
Last week the unfilled gap at 1868.99 helped to hold the index up, and the gap now becomes a key level for this week. A break below it could send the index back down to test the February low.
The upside resistance to watch will be the 20-day ema line, which held the price down last week.
Today
For the S&P500 mini-futures the 10- and 20-day moving average lines have become resistance areas. Both prevented the price from popping in the last three days. As long as the 1898-1905 zone holds the price down the ES should move back down again.
The 1865 level will become the first key support line to watch today. A move below 1855 could re-start downside selling pressure and push the price lower to the 1835-30 zone to test the long-term uptrend line.
Major support levels: 1850-45, 1830-25, 1818-17, 1800-05
Major resistance levels: 1935.50-33.25, 1950-56, 1975-78, 1993.75-96.50
Visit www.naturus.com to see Naturus.com’s full outlook for the week ahead, free of charge.
Chart: SPX long-term chart to Feb. 5. 2016