

We are now in February and the major US Indices can now be considered in bear markets. So, how should one position themselves for a rocky 2016? Let’s examine where the institutional money is flowing. Evaluating ETF fund flows daily identifies trends and major market shifts; weekly and monthly evaluations will reveal general trends. Why? Funds and RIAs (Registered Investment Advisors) are now using ETFs as an asset allocation model; therefore, watching these day to day movements can provide clues regarding how funds are positioning themselves in the market.
Let’s take a look at last week’s ETF sector flows and the themes present:
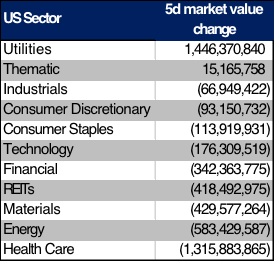
Source: Bloomberg
There are two takeaways from the above table. First, there was a general “Risk-off” and “Defensive” theme as many sectors saw outflows, including Health Care, Energy, Materials, and Financials. Second, it appears that there was a large sector rotation out of Healthcare/Biotech and into Utilities. A closer examination reveals the movement within the sector shows that money flowed out of the First Trust NYSE Arca Biotechnology Index Fund (FBT) and into the First Trust Utilities AlphaDEX ETF (FXU), see below table for details. This type of rotation can be summarized as “Defensive” positioning.
Let’s examine the next table of the largest flows by fund for the week for further themes.
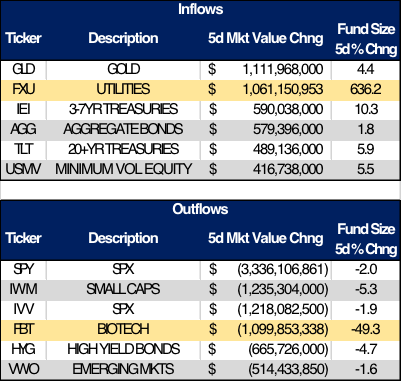
Source: Bloomberg
The “Risk Off” or “Defensive” theme is even more pronounced here. Gold (GLD) saw the largest inflow of any ETF last week. Other “Defensive” areas also saw inflows which includes Treasury related ETFs (IEI, TLT) and Minimum Volatility Equities (USMV). The same theme is present on the outflow side of the table with SPX (SPY, IVV) and Small Cap (IWM) ETFs seeing outflows.
The above analysis on a sector and individual fund basis can be classified as money moving into “Defensive” areas of the market. I will use ETF flows and technical analysis to go enter into a pair trade. While the utility sector looks a bit over extended (and vice versa with Biotech), I will use technical levels in the value area indicator (see charts below) to go long TLT (iShares 20+ Year Treasury Bond ETF) and short SPY (SPDR S&P 500 ETF Trust).
CF’s pair trade:
Go long TLT outright or the purchase the June 132/137 call spread once TLT climbs to the 127.17 price level
Go short SPY or purchase the June 183/175 put spread once SPY breaks the $185.86 price level
TLT Daily Chart
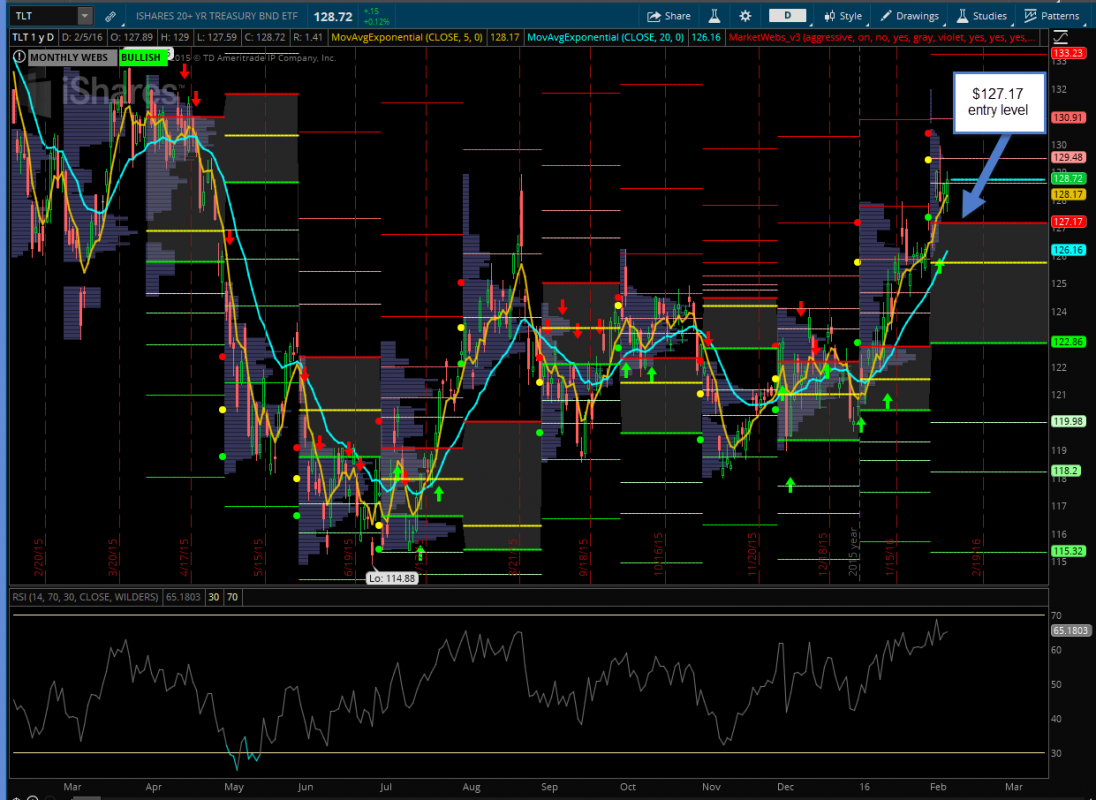
Source: ThinkorSwim
SPY Daily Chart
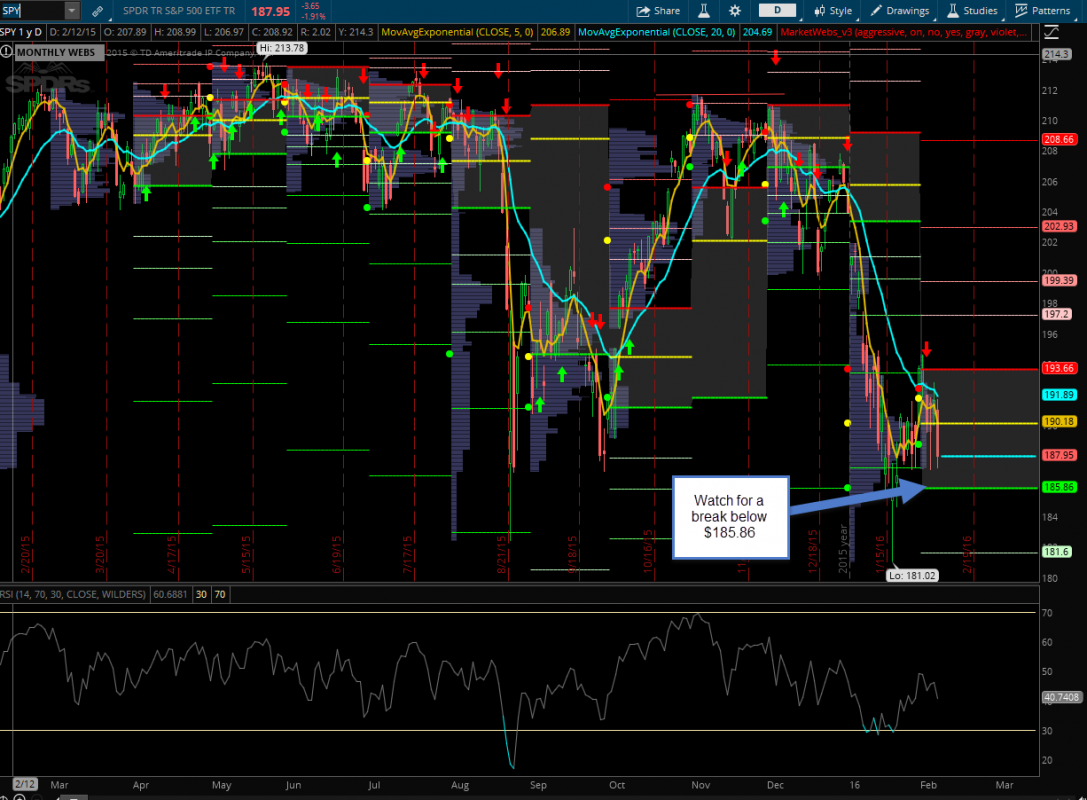
Source: ThinkorSwim

