
Persistent weakness in precious metals has thrown a lot of traders off the trades since 2012. We admit that the pattern has been challenging to count, even though we have written about several good trade entries. This post gives a big-picture update to our Elliot wave analysis for gold futures, and it shows why longer-range traders should be looking for opportunities to buy at the dips.
Prior to this writing, we had considered that the multi-year decline in gold represented merely the first part of what would become a larger corrective structure. However, we are revising our forecast to reflect the likelihood that the entire downward corrective pattern might be near completion.
Reasons for revising our forecast include:
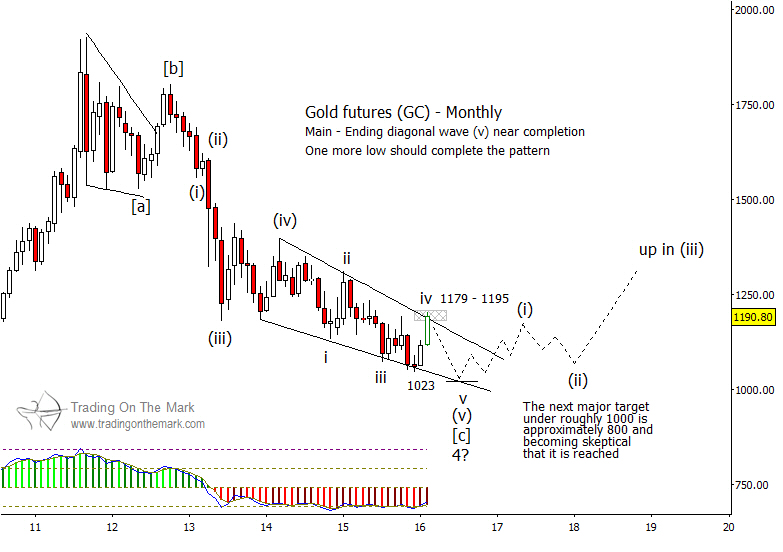
1) The internal structure of the overlapping diagonal pattern that began in 2014 does not yet look complete. It could require several more months to finish, which suggests that a mid-2016 low might correspond approximately with a forecasted high in the U.S. Dollar Index.
2) In order for the big corrective structure to contain two more large waves – of a magnitude similar to the decline from 2011 – gold prices would have to continue showing weakness for several more years. That scenario seems unlikely because it suggests that the Dollar Index would remain mostly strong over that time period. (While we believe the Dollar index can climb higher, we do not believe it will remain strong for the five to ten years that would be required for gold to complete a larger correction.)
If the big correction is almost over, then we would expect to see gold prices begin forming an upward impulsive wave this year. The impulse could eventually be quite large, although the initial stages probably would be fairly modest. For the next two years, watch for gold to remain in a range between approximately 1,023 and 1,195.

