

WTI (CL) rose 12% on Friday (February 8th) on new suggestions that the OPEC nations were set to cut oil production. In addition, the Venezuelan Oil Minister said that oil producing nations were on a “very good path” to clinch a deal. This upcoming week will shed some additional light on whether oil prices will continue to climb or are we simply in profit taking mode after the sharp sell off on Thursday (February 7th).
Weekly Chart
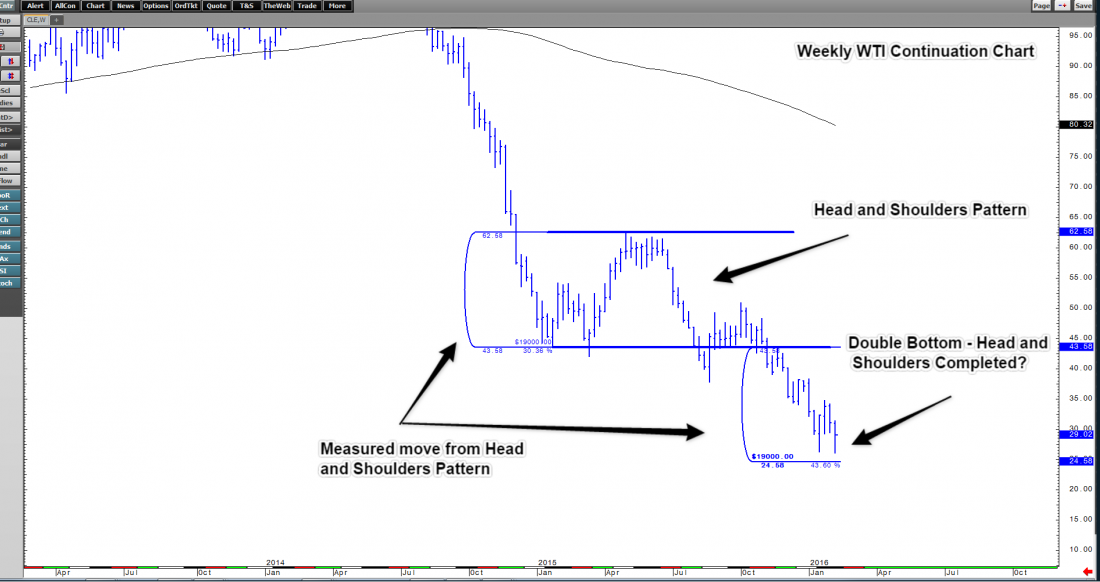
The weekly chart shows that we could be in for a bounce after we formed a double bottom this week. The lows this past week matched the lows from the week of January 18th, 2016. Also, these lows of the week fell just short of the head and shoulders measured move target of $24.58. If the move down is not finished, expect that target to be hit sooner rather than later.
Finally, the weekly chart continues to set records for the number of consecutive weeks that we have closed below the 200 SMA. This streak will not be broken anytime soon.
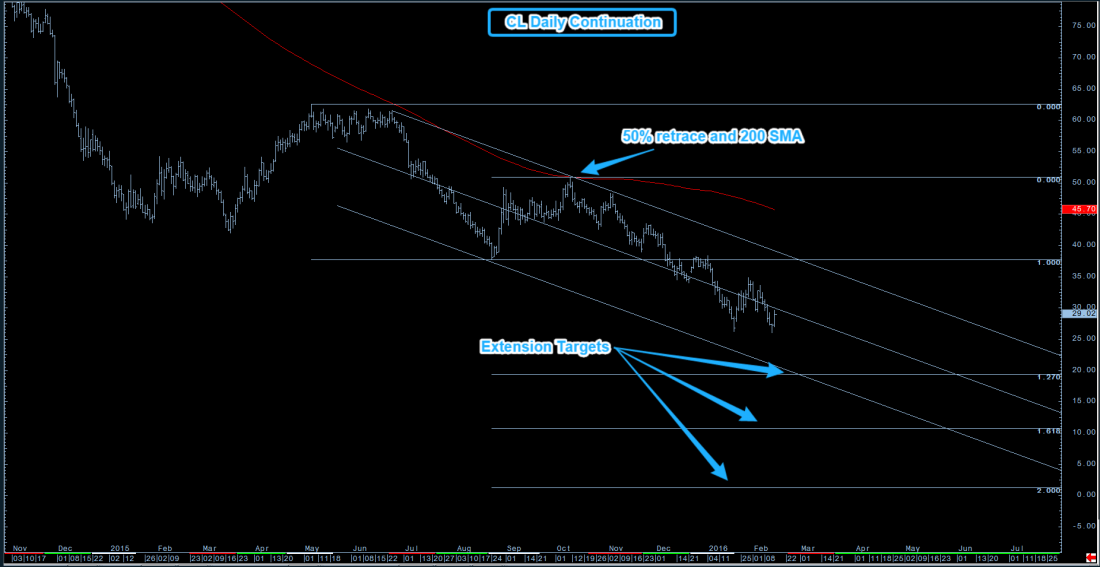
On October 9th, 2016 CL hit a bounced off of the 50% retracement level and the 200 SMA. The resulting decline has been swift and relentless, forming a classic bear trend pattern (lower highs and lower lows). The trend channel continues to hold and the median line is now being tested after Friday’s 12% rally It is not until we break the structure point at $35.06 that we will consider this a change in bearish sentiment. Channel targets and fib extension levels of $20 could be hit sometime in late February.
15 Minute Chart
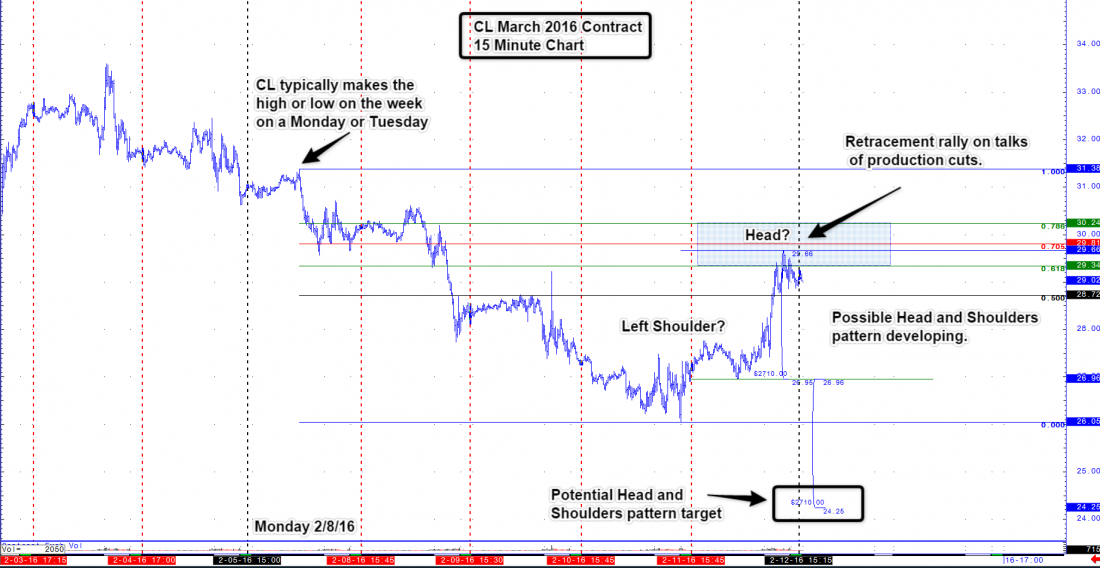
As we drill down deeper into the charts, we notice that the rally this past week was stopped right in the middle of the retracement zone measured from the week high down to the week low. Additionally, we have a potential head and shoulders pattern forming on this chart as well. If this pattern comes to fruition, we will be looking to target down to the $24.25 area which is in line with the potential target on the weekly chart.
Want the support you need for long term trading success, start with a free trial here

