Setup recognition is a huge part of trading. Being able to see the same setup across multiple markets not only provides more trading opportunities but also adds an additional layer of stress testing to the methodology. Finding a methodology that works across markets is difficult and being able to apply that methodology in a consistent basis is one of the primary keys of successful trading. Therefore, while today’s market, the lean hog futures, may not be one that’s on your radar, the setup certainly should be in your trading tool box.
I believe that the primary reason our Commitment of Traders approach works across multiple markets is because we use the commercial traders’ direct actions and sentiment within the markets they trade. It has long been our belief and has been independently statistically validated that the commercial trader category is the most consistently predictive of future price movement within a given market. When we combine their actions with basic technical analysis, we come up with a methodology that captures the synergistic effect of technical analysis’ timing and is supported by the commercial traders’ fundamental research and value based actions.
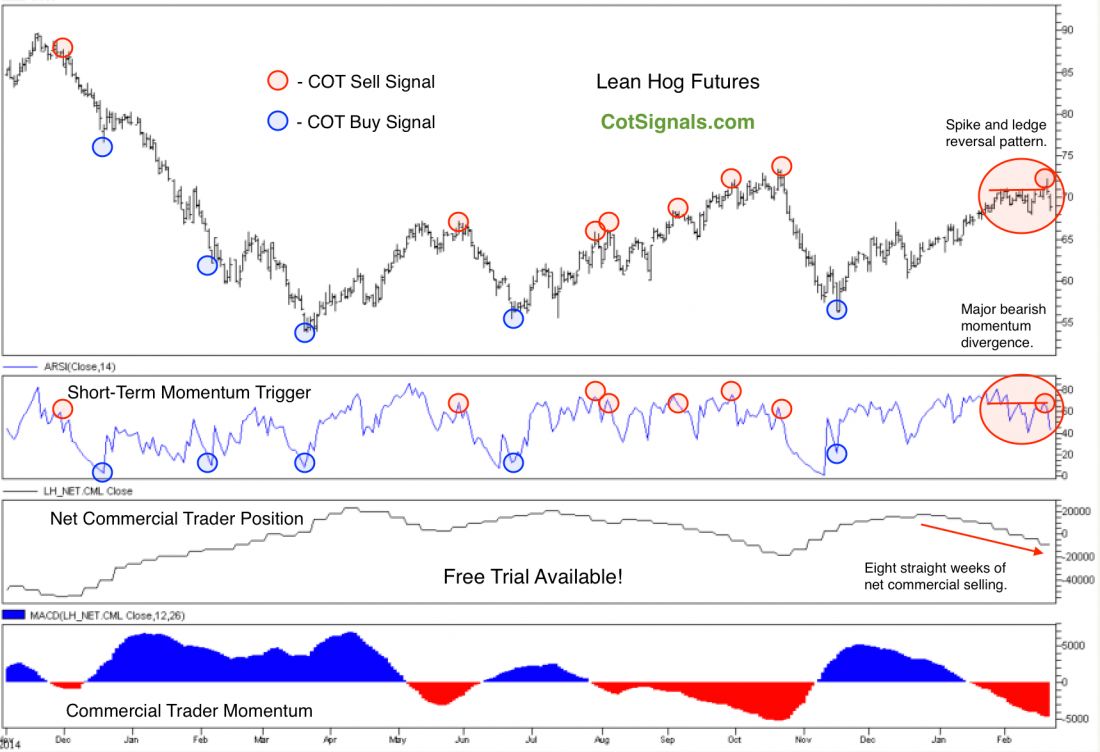
Commercial traders have been net sellers in the lean hog futures market for eight straight weeks. They’ve sold more than 25,000 contracts during this period as the market has rallied about 7%. You’ll see on the chart below that we’ve gone back to December of 2014. Normally, we wouldn’t go that far back on a short-term trading idea like this morning’s but, that’s how far we had to go to show overhead resistance beyond that of the currently forming double top between last October and the current rally.
You can see the historical Cot buy and sell signals plotted out over time on the below but, what we really want to focus on are the red highlighted areas from this past week. There are two major technical patterns that signal a reversal independently of each other. The coincidental timing of the technical reversals as fortified by the increasingly negative commercial traders’ sentiment strongly suggests this pattern is worth watching. First, the April lean hog futures finally made a new high for the week and the recent rally last Thursday but, closed near their low for the session. The new high failure shows up as the major bearish momentum divergence in the second pane of the chart. This occurs when a market’s new high is not accompanied by a new high in our proprietary short-term momentum indicator. This can also be confirmed through your favorite momentum studies like stochastic, RSI or William’s %d. The reversal continued through Friday and this creates a larger failure of roughly, a spike and ledge formation. This happens when a market builds up resistance in a tight trading range, finally pushes through but can’t hold. Finally, it falls through the bottom of the congestion that had been supporting it.
The market only provides so much data. Most studies and indicators are simply different calculations of the same numbers – open, high, low and close. Find indicators you understand and plot them across multiple markets. Overall, the addition of the commercial trader net position data stream is the key to increasing the likelihood of our classis technical analysis bearing fruit. We only look for trades in line with the commercial traders’ momentum as plotted in the bottom pane of the included chart.
Even though lean hogs may not be your market of choice, this methodology has proven robust across multiple markets and sectors. Try it on your own favorite market and see what it looks like with your own eye. As it is, we’ll be selling April lean hog futures and placing a protective buy stop at Thursday’s high. We’ll look to the commercial trader category to see what price brings them back to the market on the buy side at which point, we’ll reevaluate the short position.