

The world’s most-watched stock index broke beneath channel support around the beginning of the year, and recent weeks have seen it approach the broken support line from below. If the trend on daily and weekly charts turns downward again in March, we would view that as a confirming signal that the index is working through the count shown on the chart below.
As we mentioned in our newsletter this week, the next phase of a bear market may be tricky for traders who try to get on board the downhill train too early. One of the reasons is that the macro structure of the decline is likely to take the form of connected three-wave moves rather than a quick, impulsive move to test the lows of 2008-2009. As a rough approximation, we expect to see a pattern that is similar to the market decline of 2000-2003 instead of the one from 2007-2009. That is why we have labeled the projected low for mid-2016 in the Dow Index as [a] rather than [1].
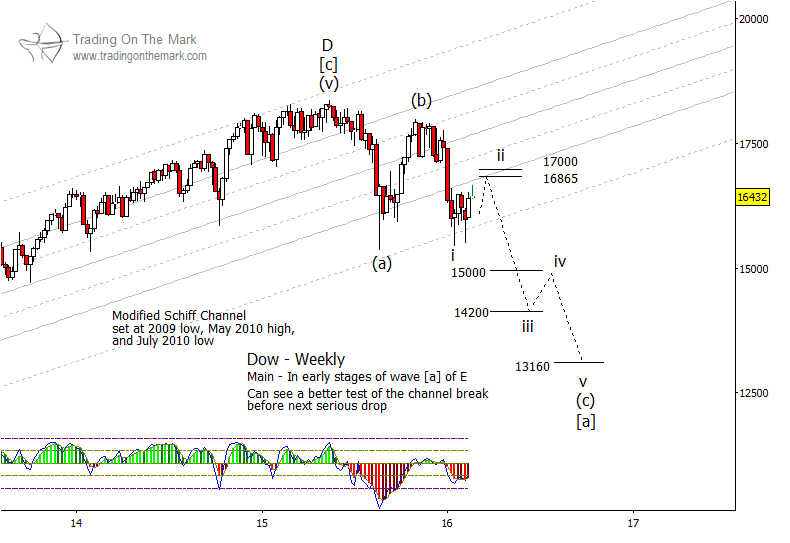
On a slightly smaller scale, which may be tradable on a weekly chart, we expect to see the next phase of the decline take an impulsive form, with five waves taking price down into the lowest targets shown here. Potential resistance areas to watch for the downward trend to resume include 16,865 and 17,000, and projected downward target areas include 15,000, 14,200, and 13,160. Eventually, the index should fall considerably lower than those levels in a slide that could last until 2018 or 2019.
Our newsletter this week discusses the larger, multi-year pattern in the Dow as well as possible trade scenarios for the Russell 2000 Index and its associated ETF. Click here to request your copy!

