

Recently, I introduced the idea of trading the intraday waves of the markets in a TraderPlanet article. You can access that article by clicking this link: Do You Surf the Market Waves? Here is another article on wave trading, this time in Crude Oil and for swing trading the daily chart.
Waves help the astute trader measure the supply and demand (i.e., the selling and the buying) in the market. Because markets move on supply and demand, we always want to know which is the dominate force, sellers or buyers. We can see this clearly in the waves of the market.
Surfing the Waves of Crude Oil
The Crude Oil futures market shows how helpful wave analysis can be to the swing trader. Just as with intraday charts, we assess the waves or swings of the market, both in terms of length of waves and the amount of volume each wave carries. We use David Weis’s Weis Wave tool to plot our waves.
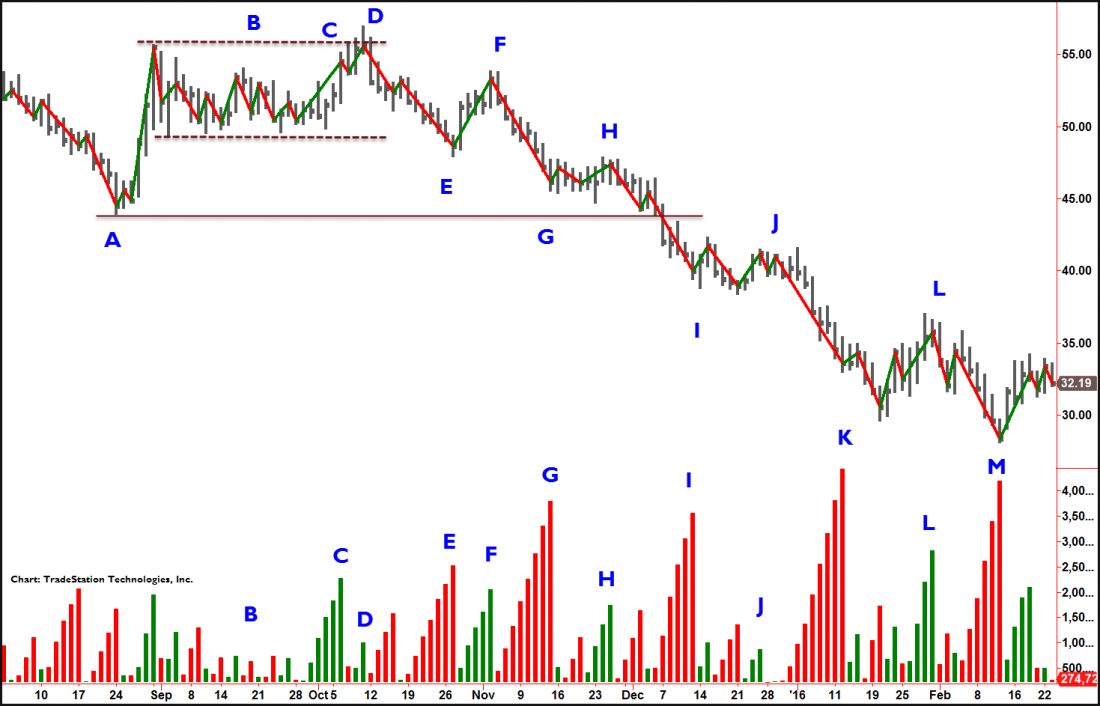
Crude Oil made a low in August 2015 at A, and then rallied up, forming a multi-week trading range at B. As the market started to rally to the top of the trading range at C, it looked like Crude would break out and trade higher. But when price did reach the top at D, we see not only was it unable to sustain the breakout, but volume on the D wave was very light. This indicates buyers are not actively buying the top of the range—a classic “no demand” signal and an excellent short opportunity.
How to Tell Supply Is Dominate
When the market couldn’t push to new highs, the question then became, “Will sellers now come in to push price lower?” The answer came on the wave down to E with both the length of the wave expanding compared to recent up and down waves, and the downside volume growing. Supply reasserted itself and was now the dominate market force, giving another short opportunity on the failed rally into the middle of the trading range at F.
The drive down to G with good wave length and greater downside volume told in advance that the August low at A was vulnerable. The inability to rally marked by the small up wave and up volume at H indicated a lack of buying strength, and the market easily slid through the August lows down to I.
You can see at I supply was dominating Crude Oil. Any attempt by buyers to try and rally the market (at H & J) was feeble and offered fresh shorting opportunities. Selling waves were large and had strong downside volume all the wave to K.
Early Indications a Rally Is Coming
Now we come to the live end of the chart and the waves are telling us something interesting. Note that the wave down to M had almost as much volume as K, but the downside progress was limited. On similar volume, the market moved down over ten points from J to K. The move from L to M is only half the length of wave J-K. Because the length of the wave shortened, we can surmise that hidden in that downside volume was a lot of buying. Buyers were likely stepping in and, through their buying, preventing price from falling lower, thus causing a shortening in the wave. This may be significant.
What we next want to see is a move back down into the area of the low at M. The next wave down may reach the low at M, go a little under it, or hold a little higher. Whatever it does, we will want carefully assess the volume on that wave. If it is significantly less, it will indicate that selling is drying up and paving the way for a rally above L, and perhaps to J and higher, if buyers step in strongly.
Wave analysis is an excellent way to view what really drives the markets: demand and supply. It can be combined with other forms of technical analysis, adding power to that analysis. For more on surfing the waves, you are invited to the author’s website where you can learn this kind of trading. Just click here.

