Overview – Week of 2/22/2016
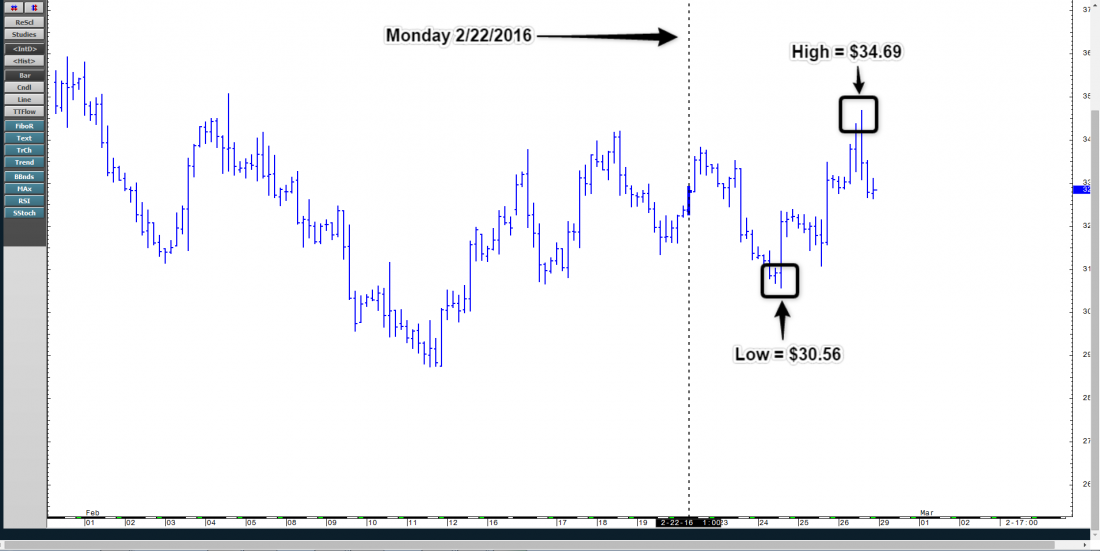
Our analysis last week included two levels that we felt would hold and would be tradeable areas. And indeed that was the case. For review of these levels take a look at last weeks “weekly” analysis post.
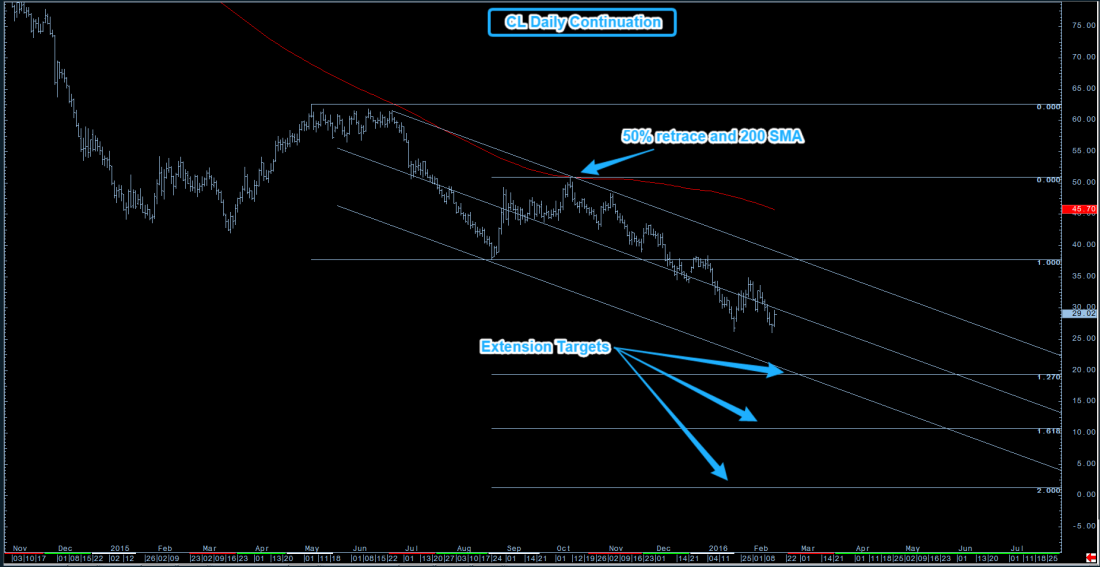
Weekly Chart

Oil was largely in a sideways trading range as the market prepared for an announcement this week of a potential production freeze agreement between OPEC and Non-OPEC producing nations. Sentiment for upcoming week is Neutral | Choppy Trading Conditions

CL tested the top of this bearish channel and was rejected. The market has begun to trade sideways but is still significantly below its 200 period SMA.
But until we break above the channel and start to make higher highs, my overall sentiment remains bearish.
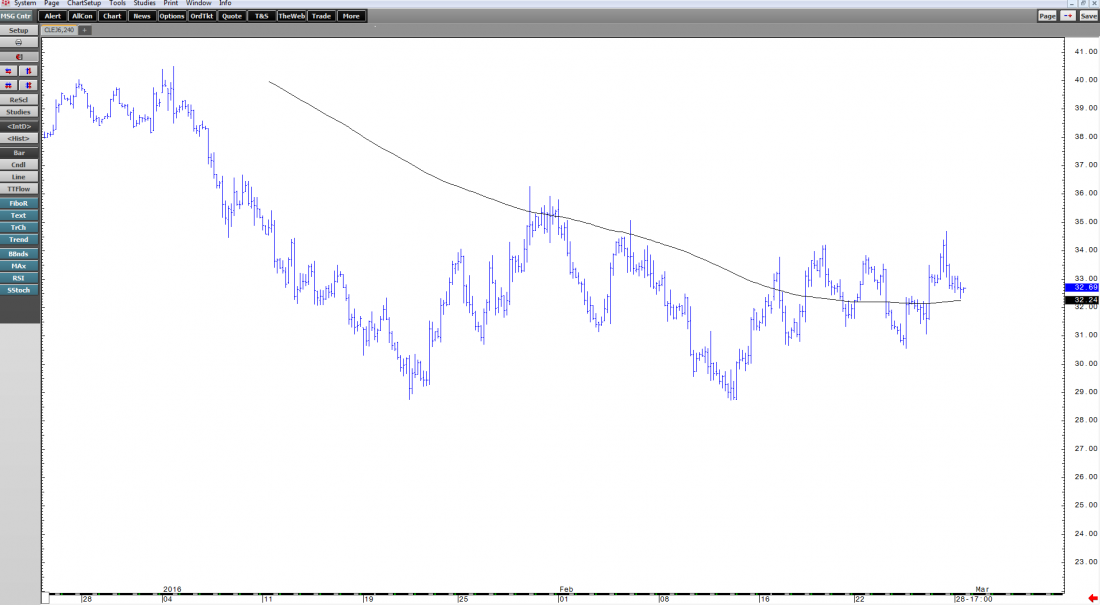
240-Minute Chart

We crossed the 200 period SMA and have closed above it during this past trading week. The market has clearly moved into a sideways (neutral bias) and will present some difficult trading conditions until we begin to start trending again.
My overall sentiment has shifted to Neutral.

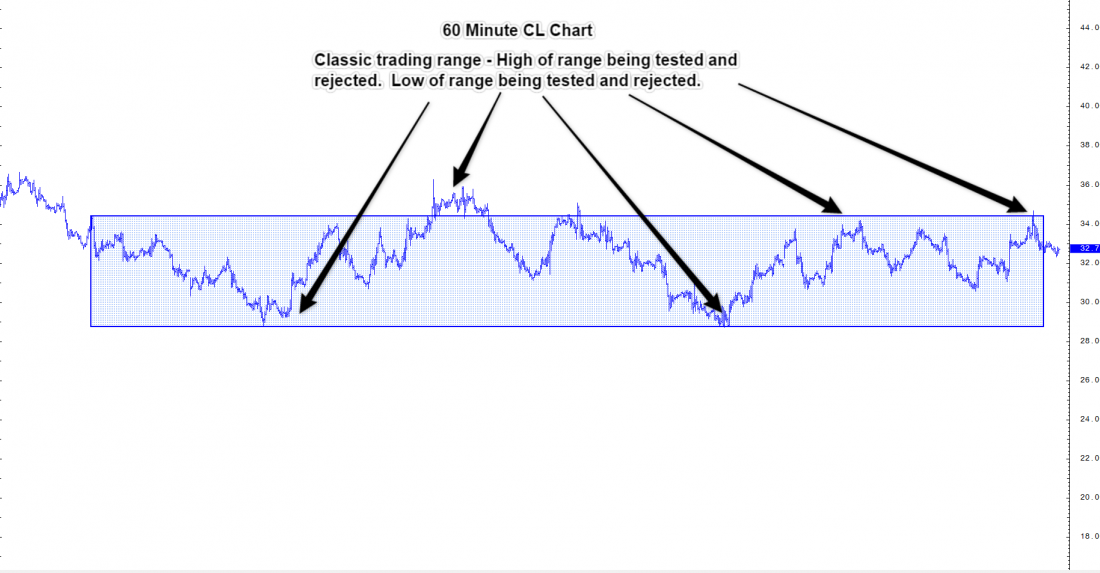
This chart continues to show just how choppy and “sideways” the market has become. In a classic range bound market, the high of the range is tested and rejected and then the low is tested and rejected. This pattern has been repeating itself (in a $5.65 range) since early January 2016.
My overall sentiment remains Neutral.
Weekly Price Targets
These are price points on the chart where I would be interested in making a trading decision. I would fade the long targets to get short and fade the short targets to get long.
Long Targets
34.00 – 34.30
34.85 – 35.00
35.50 – 35.70
Short Targets
31.04 – 30.80
29.84 – 29.64
28.65 – 28.50
To receive a free trial from the Oil Trading Group, Click Here


